

ETH Marketcap / Ethereum
ETH daily analysis January 2026. Ethereum is currently printing a corrective pullback within a broader bullish impulse, with price retesting a strong demand area that becomes the key decision zone for continuation versus deeper retracement.
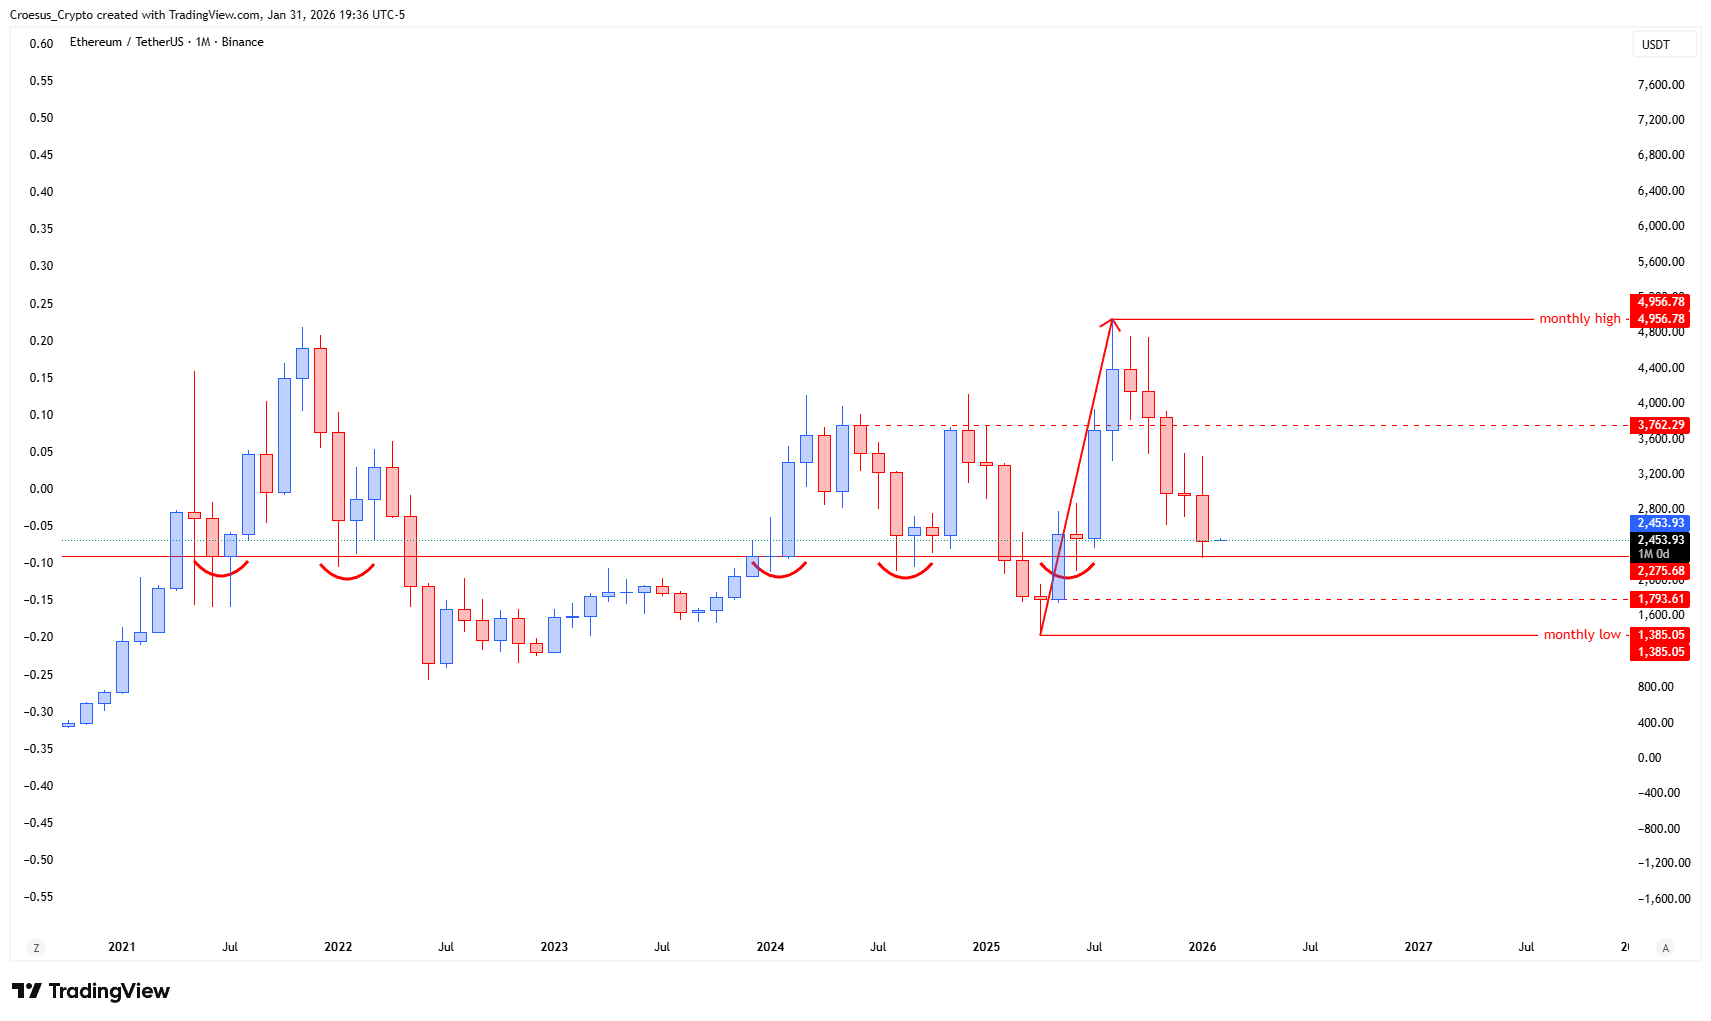
- Price shows us a corrrection of a bullish impulse, retesting a strong buy zone.
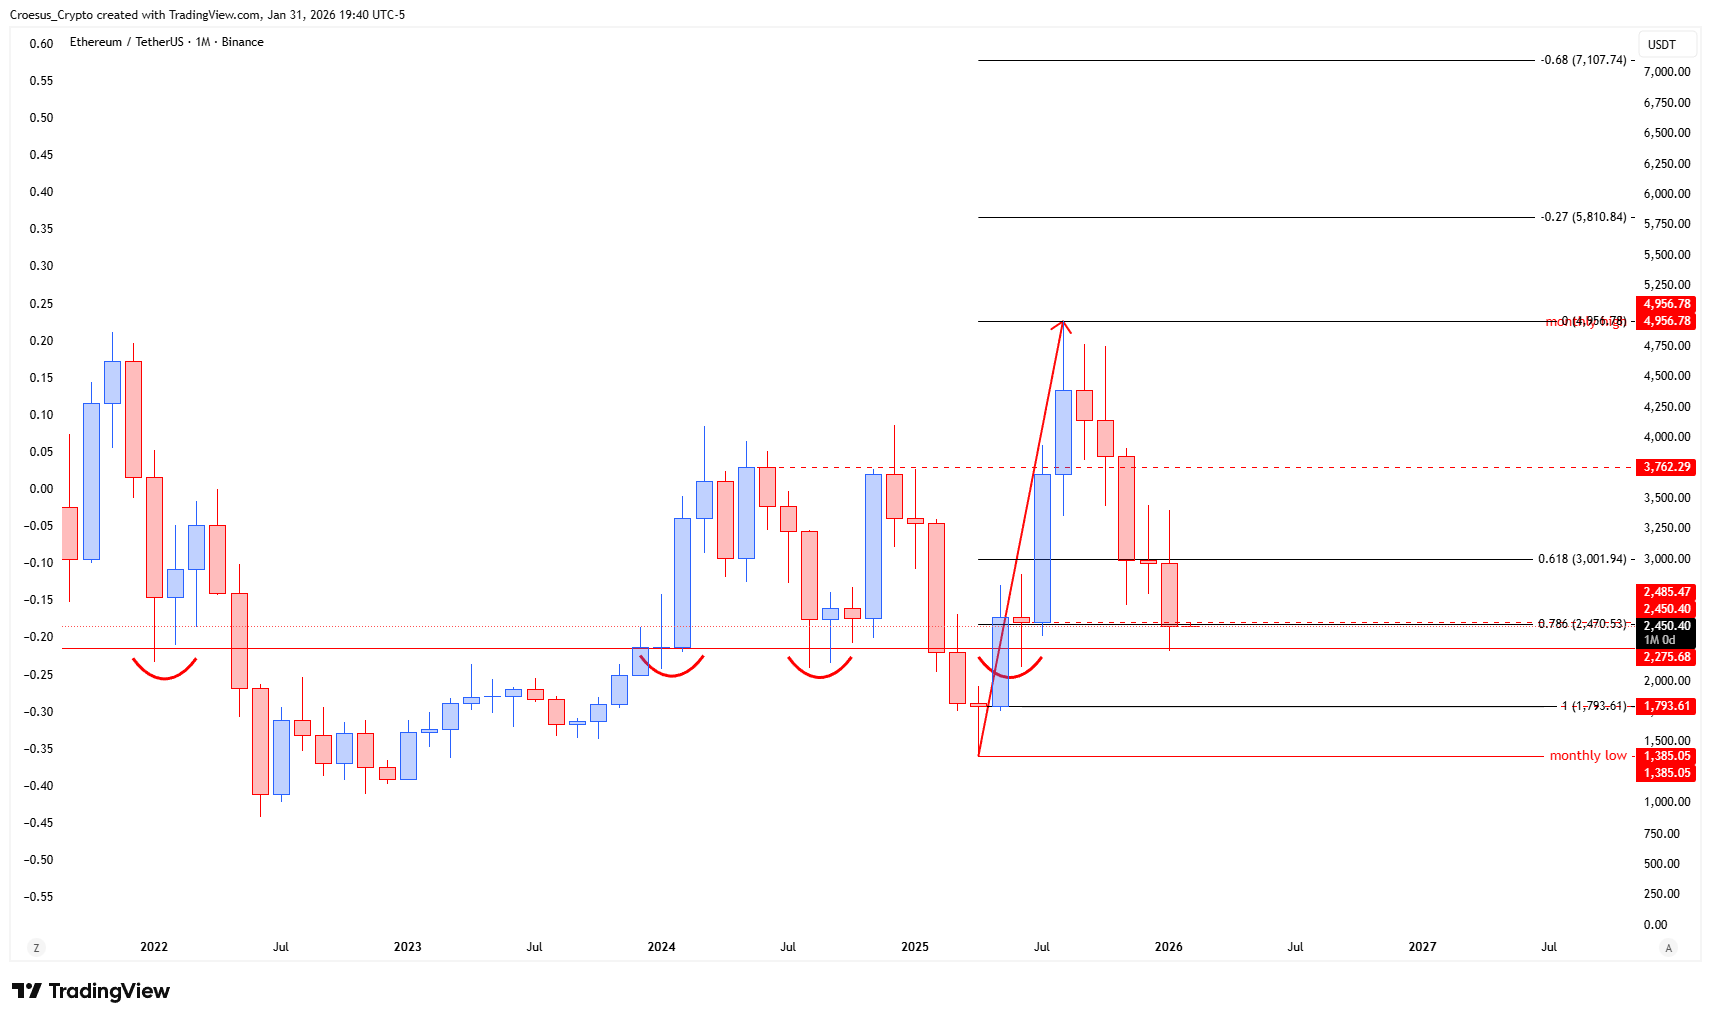
- We can see that price pulled back into the golden zone, touching the 0.786 retracement level.
- This zone and the level of retracement let us look at long set-ups on the lower timeframes, starting with the 4h timeframe.
Market Structure Analysis
From a market structure perspective, ETH daily analysis remains defined by an impulsive leg up followed by a corrective structure back into prior demand. The retracement into the “strong buy zone” signals that price is revisiting a former support area where buyers previously stepped in, making this a pivotal support resistance zone for the next swing.
The mention of the golden zone and a direct touch of the 0.786 Fibonacci retracement reinforces that the current move is not random chop, but a measured pullback into a technical confluence area. If buyers defend this retracement region, the next meaningful objective is a continuation attempt back toward the prior swing high from the impulse. If the zone fails, the correction can extend and the bullish impulse structure weakens until a new base forms.
Key Levels and Scenarios
In this ETH daily analysis, the bullish scenario stays intact as long as price holds the strong buy zone and stabilizes after the 0.786 retracement touch, allowing a shift back into an impulsive move. The bearish scenario activates if price loses acceptance in this buy zone, turning the retracement area into resistance and confirming that the correction is still in control.
- Strong buy zone (current retest area) as primary structural support
- Golden zone as the key retracement region price pulled back into
- 0.786 Fibonacci retracement level as the precise reaction point to monitor
- Lower timeframe (4h) structure inside this zone as the trigger context for continuation vs failure
Trading Implications
This is a decision area where aggressive participants typically look for confirmation on the 4h, while conservative participants wait for clear evidence that the correction has ended and impulse structure is resuming. Risk is elevated if price remains choppy inside the zone, because failed bounces often lead to deeper corrective extensions.
This analysis is for informational purposes only and does not constitute financial advice.