

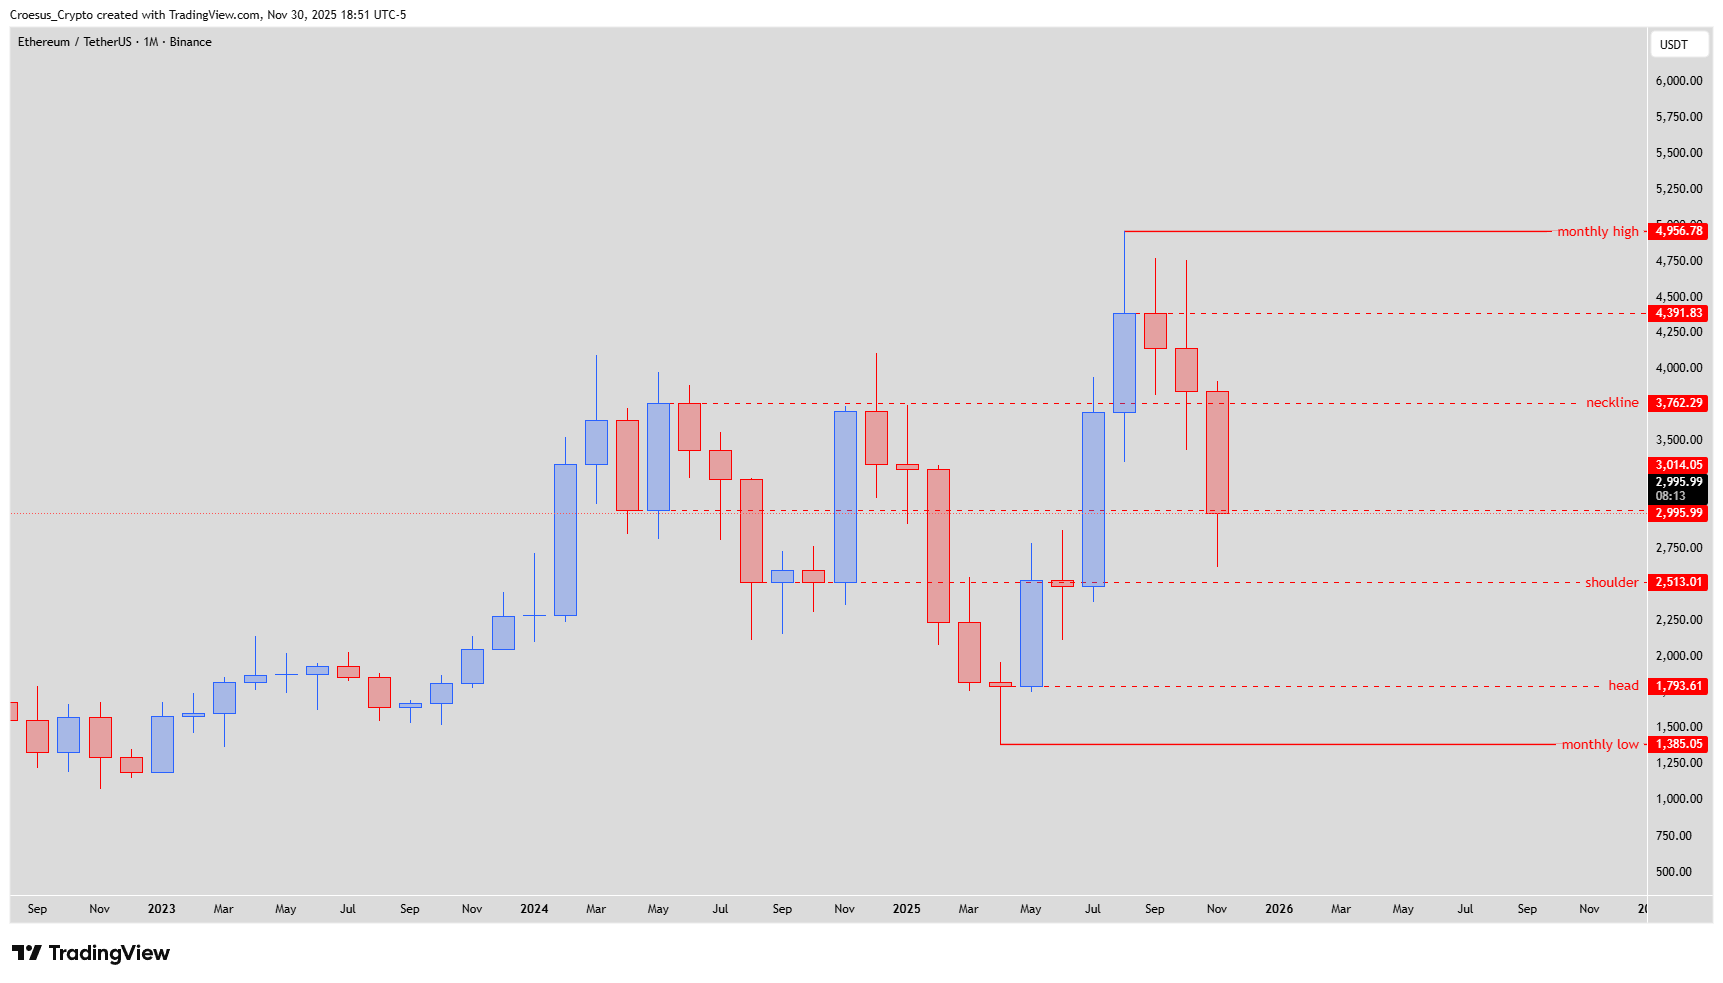
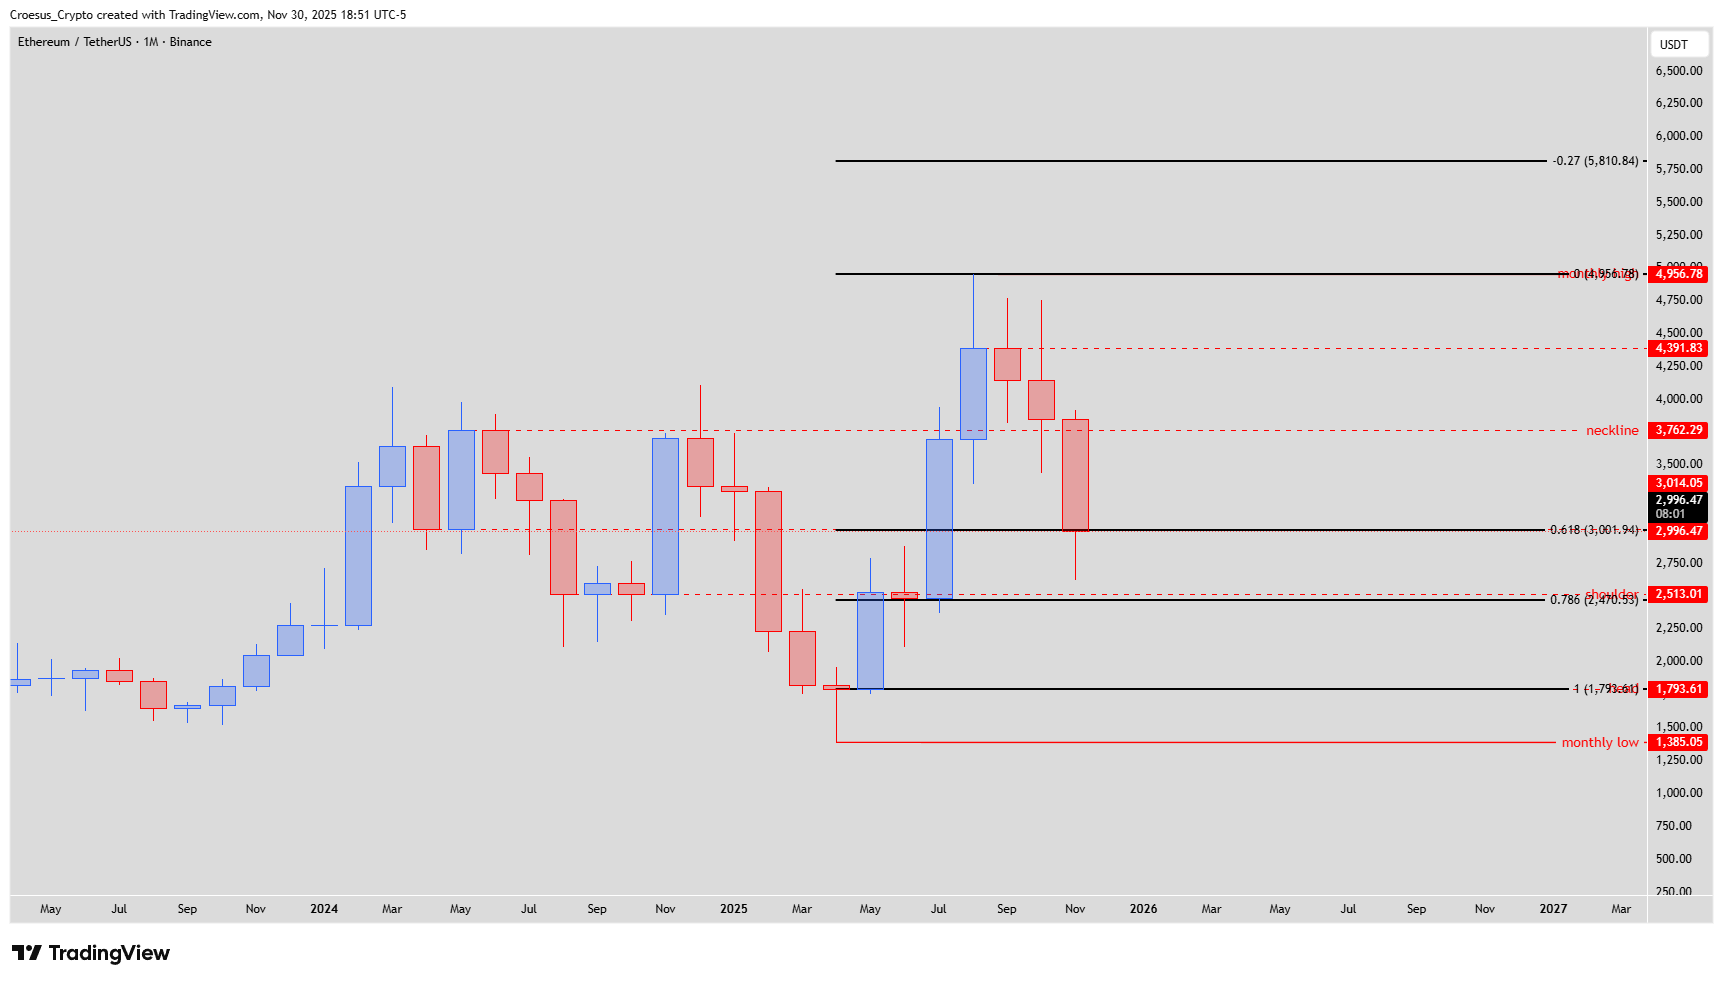
This Ethereum monthly analysis focuses on the developing inverse head and shoulders that has formed after the strong rally from the 1,385.05 $ monthly low to the 4,956.78 $ high. November extended the correction from that high and closed around the 0.618 retracement at ~3,001.94 $, still clearly above the head at 1,793.61 $ and the prior shoulder at 2,513.01 $.
Ethereum monthly chart Nov 2025 with Fibonacci retracement from 1,385.05 $ to 4,956.78 $, showing 0.618 and 0.786 levels and projected -0.27 extension at 5,810.84 $.
Technical Analysis Key Points
Price has retraced to the 0.618 Fibonacci of the last impulsive leg and is trying to hold above ~3,000 $.
The shoulder level at 2,513.01 $ marks the initial demand area of the pattern; current structure still trades above it.
The head at 1,793.61 $ and the monthly low at 1,385.05 $ remain untouched, keeping the macro inverse H&S valid for now.
The neckline sits at 3,762.29 $, with further upside levels at 4,391.83 $ and the monthly high 4,956.78 $, and a projected -0.27 extension at 5,810.84 $ as potential cycle targets once a breakout confirms.
Market Structure Analysis
Structurally, ETH completed a clear impulse from 1,385.05 $ to 4,956.78 $, then rotated back into a Phase-1 correction. The current monthly candle shows sellers in control, but the market is still forming what can become the right shoulder of the inverse head and shoulders as long as monthly closes stay above 2,513.01 $.
Defence of the 0.618 area fits a healthy corrective pattern: deep enough to reset sentiment, not deep enough to invalidate the higher-timeframe bullish structure. The critical invalidation lies much lower, at the head and monthly low; until those are broken, the broader technical analysis bias remains bullish but corrective.
Key Levels and Scenarios
Bullish scenario
Buyers defend 3,001.94–2,513.01 $ and print higher lows.
A decisive monthly close above the neckline at 3,762.29 $ signals completion of the inverse H&S.
Targets then open toward 4,391.83 $ → 4,956.78 $ and, on strong momentum, the -0.27 extension around 5,810.84 $.
Bearish scenario
A monthly close below the shoulder at 2,513.01 $ warns that the pattern is weakening and increases risk of a full retest of the head at 1,793.61 $.
Loss of the head shifts the structure into a broader downtrend, with the 1,385.05 $ monthly low as the next major downside magnet and invalidation for the current bullish cycle map.
Trading Implications
Within Croesus Crypto, this is a bullish but fragile correction: swing entries favour staggered positioning in the 3,000–2,500 $ zone with invalidation below the head, while aggressive trend-following exposure is best reserved for a confirmed neckline reclaim and monthly close above 3,762.29 $.
This analysis is for educational purposes only and is not financial advice or a recommendation to buy or sell any asset.