ETH Marketcap / Ethereum
ETH weekly analysis Week 10 2026. Ethereum remains in a bearish corrective environment as price continues to react around a defined range, with sellers defending the range high after a failed attempt to break higher.
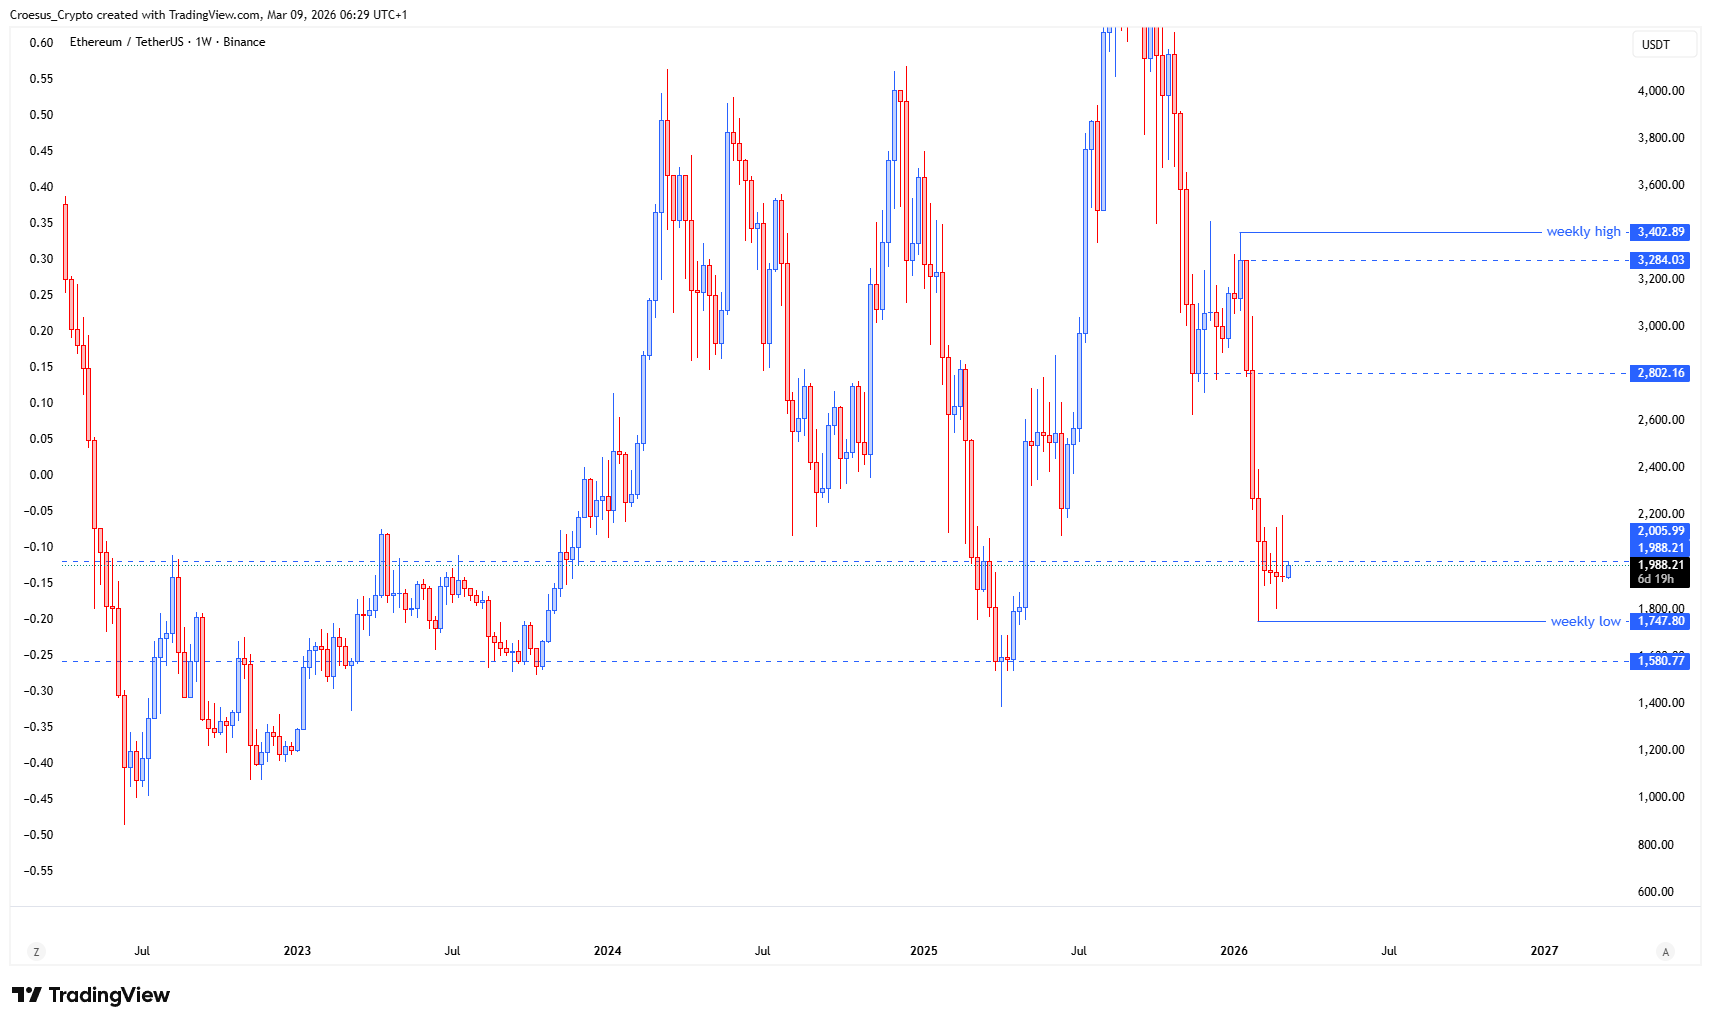
- The ETH price tried to push higher this week past the range high but failed.
- We would to see a break and retest of the range high, closing above the range high this week
Market Structure Analysis
From a naked-trading perspective, our ETH weekly analysis continues to frame price action as range-bound inside a broader bearish context (PHASE 1 corrective phase).
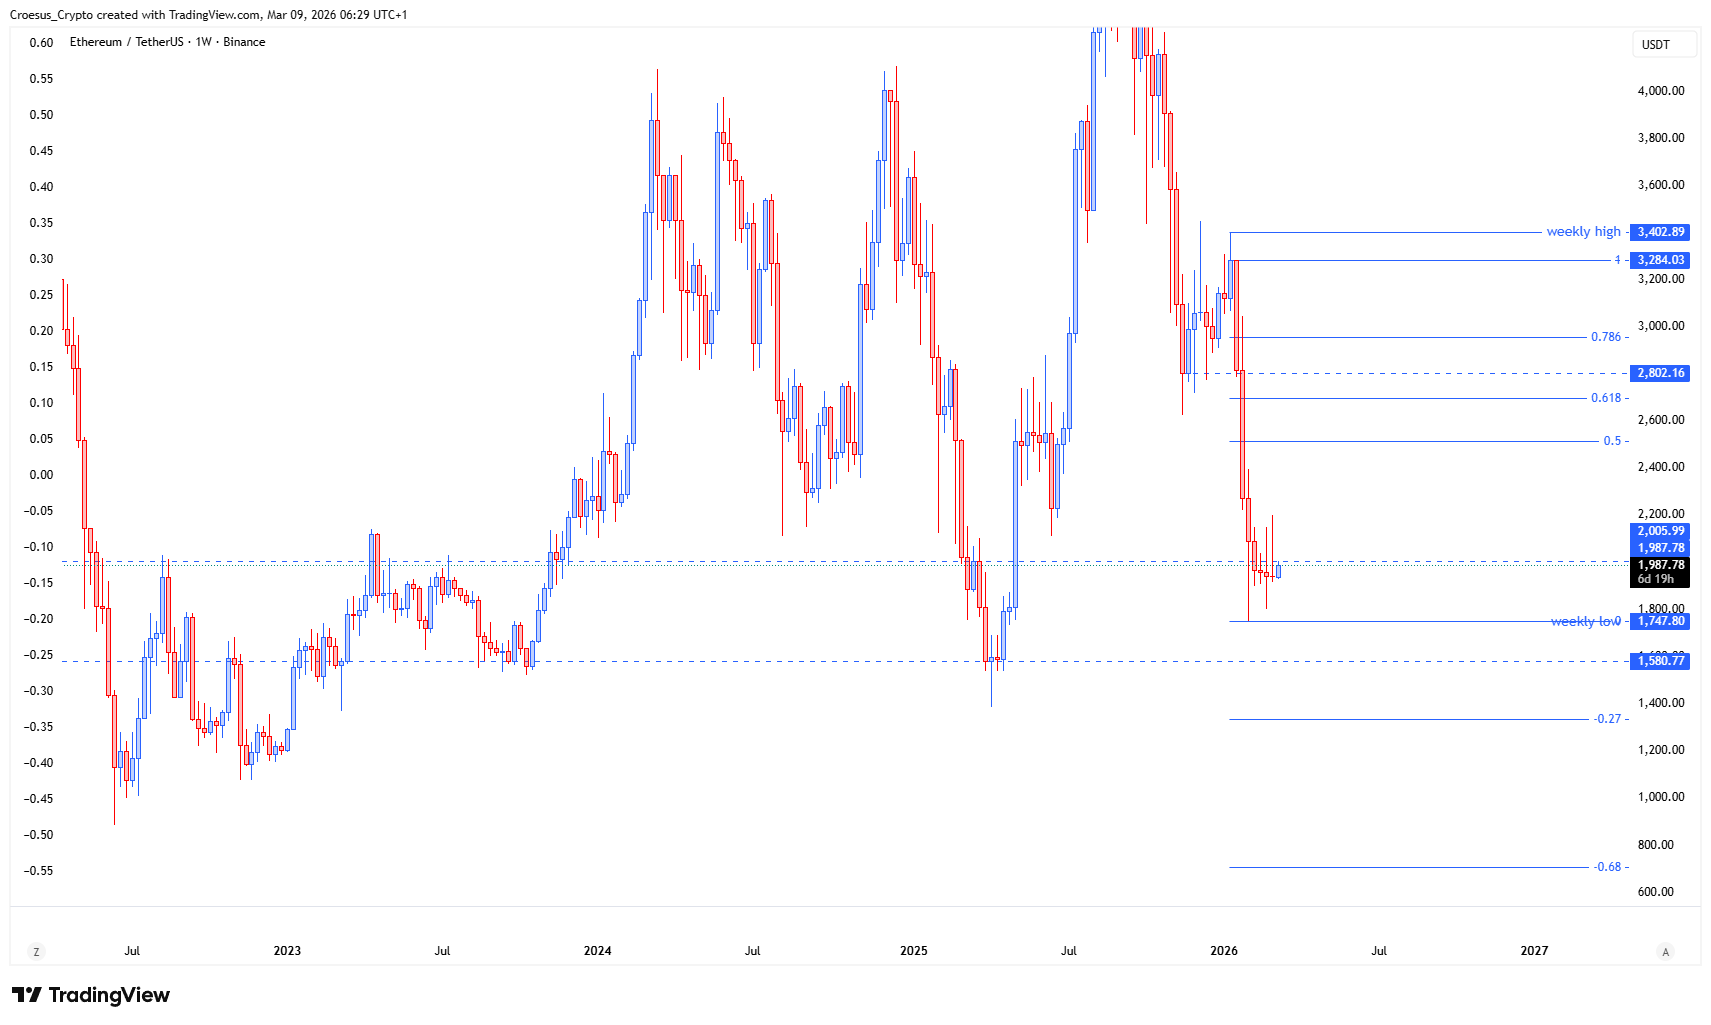
The attempted expansion above the range high that failed is structurally important because it signals a liquidity probe into resistance, followed by acceptance back inside the range. When price cannot hold above a range high, it typically keeps the market in corrective mode and increases the probability of rotation back through the range rather than immediate continuation higher.
Until we see a clean break and retest with a weekly close holding above the range high, the move is treated as a rejection at resistance and not a confirmed shift in market structure.
Key Levels and Scenarios
Bullish resolution in this ETH weekly analysis requires reclaiming the range high with a break, retest, and weekly close above it to flip prior resistance into support. If the range high continues to reject price, the bearish corrective scenario remains active, with risk of continued rotation back toward the lower boundary of the range.
- Range high: primary resistance; needs a break and retest to confirm strength
- Weekly close above the range high: confirmation trigger for a potential structure shift
- Range low: key downside support zone if rejection continues
Trading Implications
Structurally, this is a patience zone: aggressive positioning into resistance is higher risk while the range high holds, while more conservative traders typically wait for confirmation (weekly close and retest acceptance). In PHASE 1 conditions, false breaks are common, so validation comes from how price behaves after the retest, not the initial push.
This analysis is for informational purposes only and does not constitute financial advice.