ETH Marketcap / Ethereum
ETH weekly analysis Week 11 2026. Ethereum is attempting to stabilise after a broader bearish impulse, and current price action reads as a corrective bounce rather than a confirmed trend reversal. Our ETH weekly analysis focuses on whether this push can build structure, or if it remains a short-lived relief move into overhead supply.
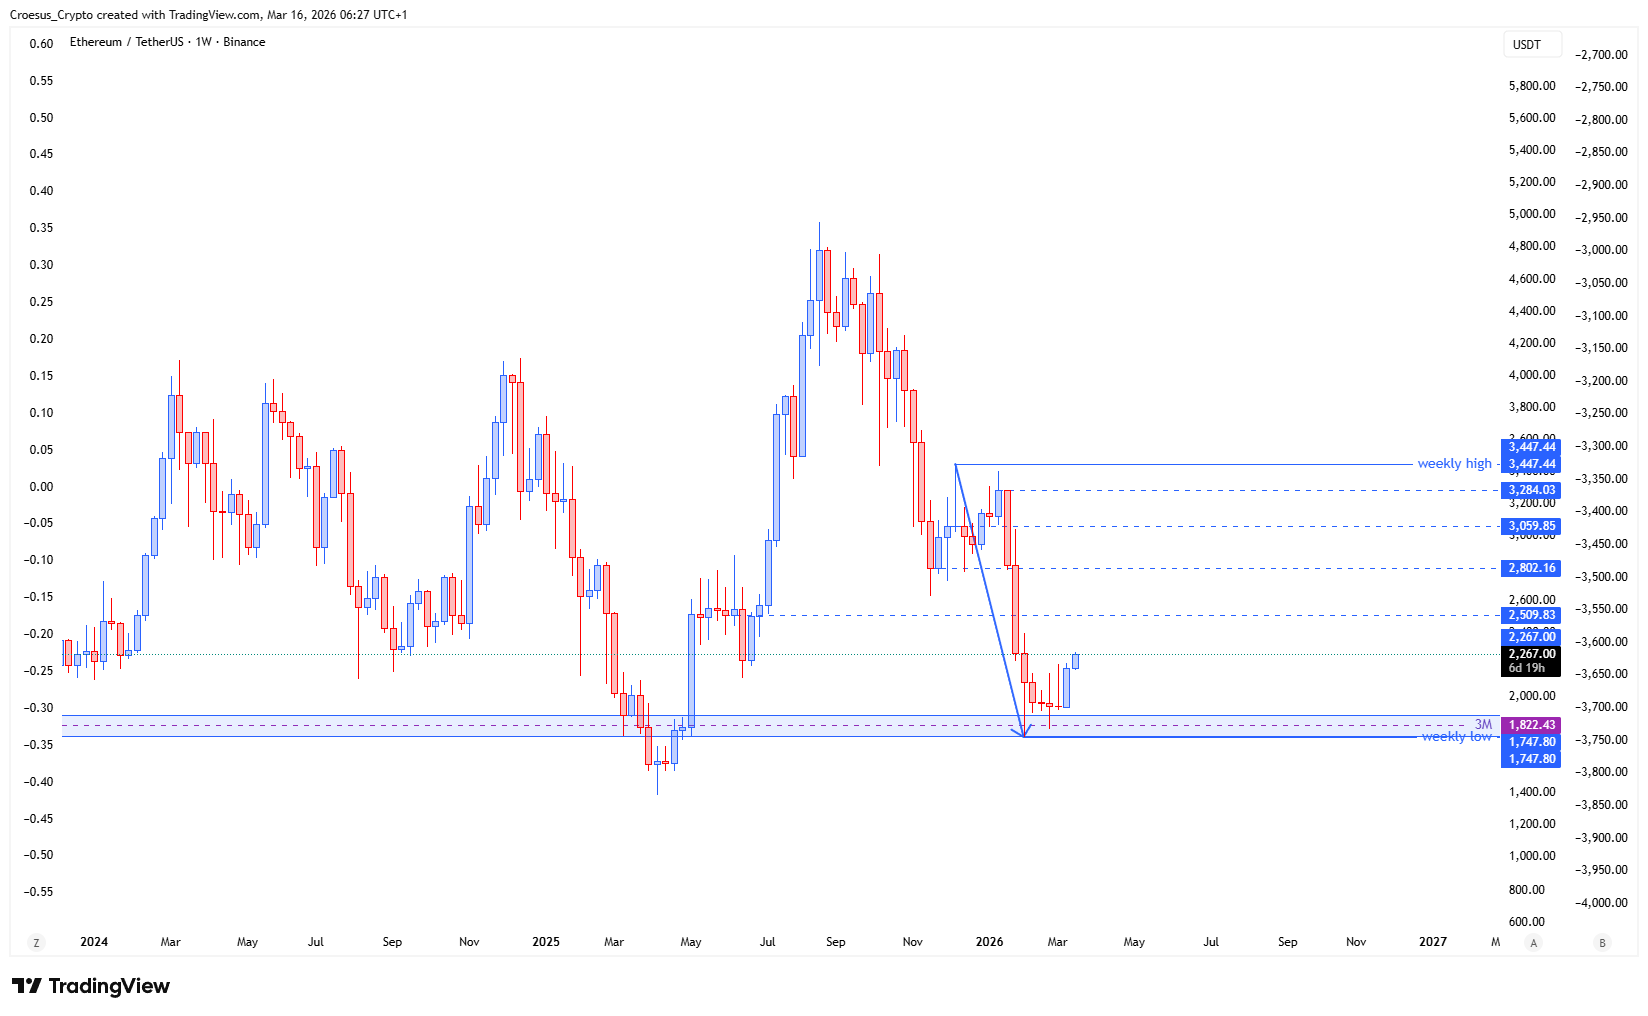
- The ETH price pushed back higher, as high as the week before, but managed this week to close at its weekly highs.
- Eventhough this bullish move shows renewed strength of the bulls, it is still the start of a possible relief rallye of a larger bearish impulse.
Market Structure Analysis
Structurally, ETH is printing a higher weekly push that tags the prior week’s high and still closes strong into the weekly highs, which is typical of short-term demand returning after sell-side exhaustion.
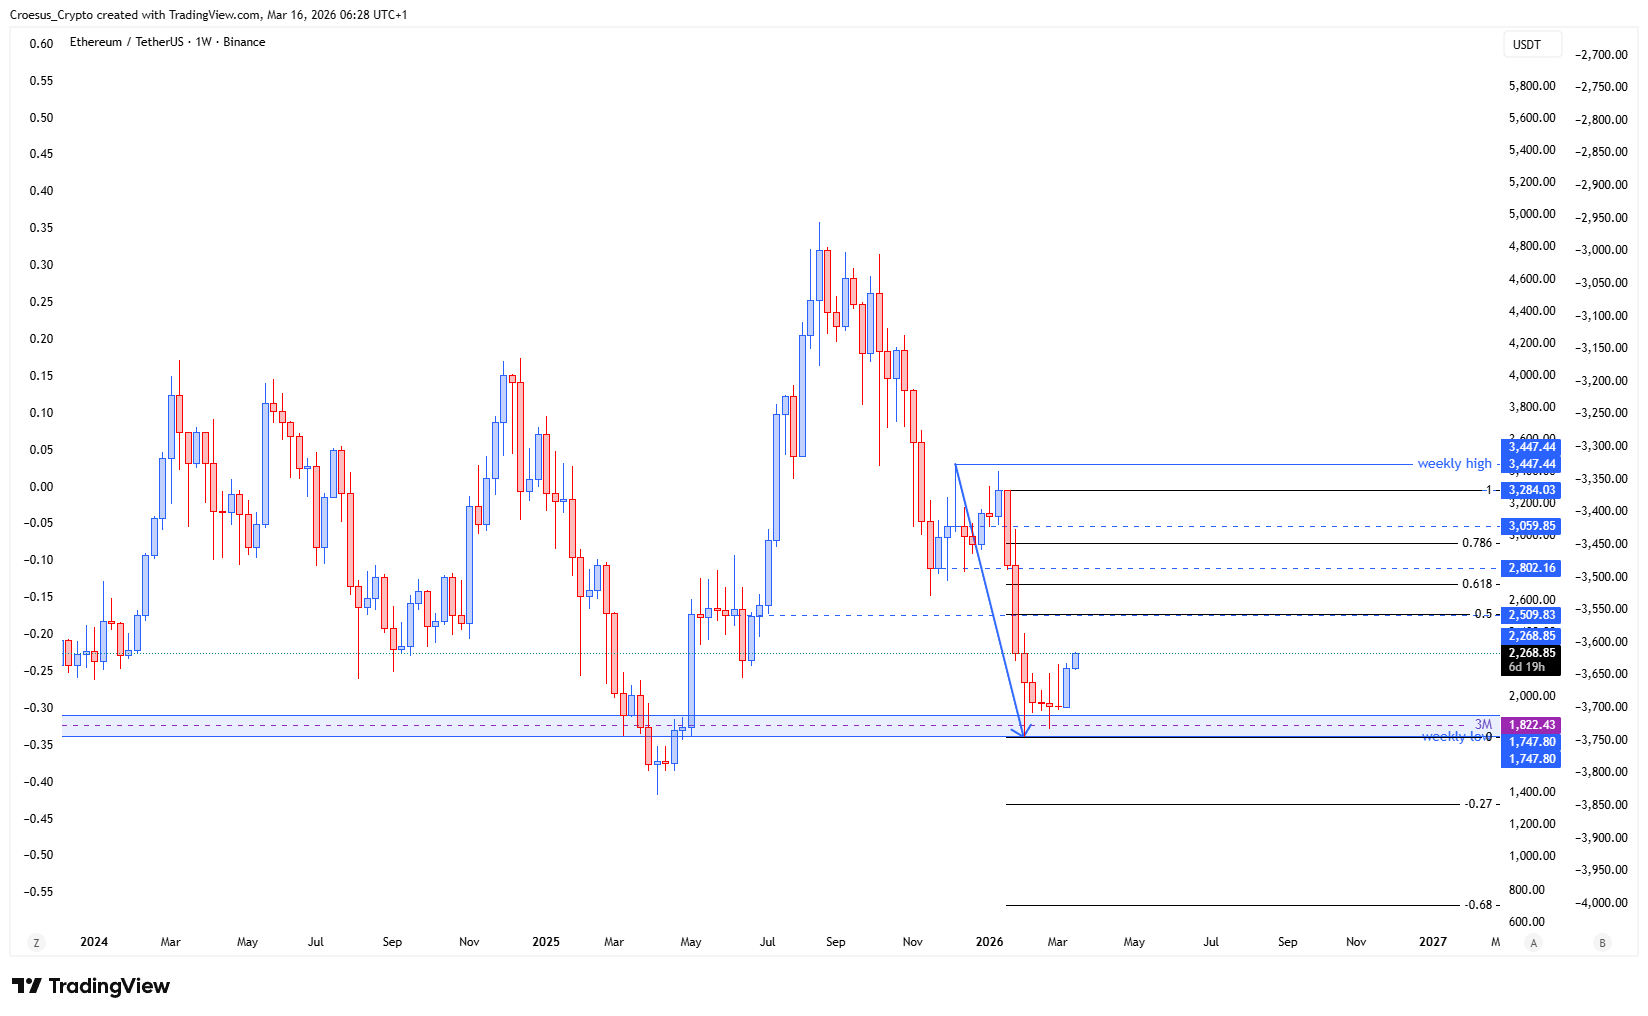
However, with trend context flagged as bearish PHASE 1, this move is best read as a corrective structure inside a larger downtrend: a relief rally that can retrace into resistance before the market decides on continuation. In a bearish environment, the key question is whether this bounce can create a clean break of structure (new swing highs held on a retest), or whether it simply offers liquidity for sellers at overhead support resistance zones formed during the prior impulse.
Key Levels and Scenarios
In our ETH weekly analysis, the bullish case requires follow-through above the prior week high and acceptance (holding that area on a retest), signalling that the corrective bid is transitioning into a more durable structure. The bearish case remains favoured if price rejects from the current weekly-high region and rolls over, keeping the relief rally contained within the broader bearish impulse.
- Prior week high (first overhead resistance that must be reclaimed for continuation)
- Current weekly-high close zone (acceptance vs rejection area)
- Most recent swing low from the bearish impulse (key downside reference/invalidation for the bounce)
- Corrective range low (failure point that reopens continuation risk)
Trading Implications
Aggressive participants typically treat this as a corrective environment: strength can be traded tactically, but risk management stays tight because rejection from resistance can be sharp in bearish PHASE 1. More conservative traders generally wait for a clear break of structure and a clean retest before assigning reversal probabilities.
This analysis is for informational purposes only and does not constitute financial advice.