ETH Marketcap / Ethereum
ETH weekly analysis week 12 March 2026. Ethereum is attempting a short-term relief bounce, but our ETH daily analysis still frames this move as corrective while the broader market structure remains bearish and reactive around prior breakdown levels.
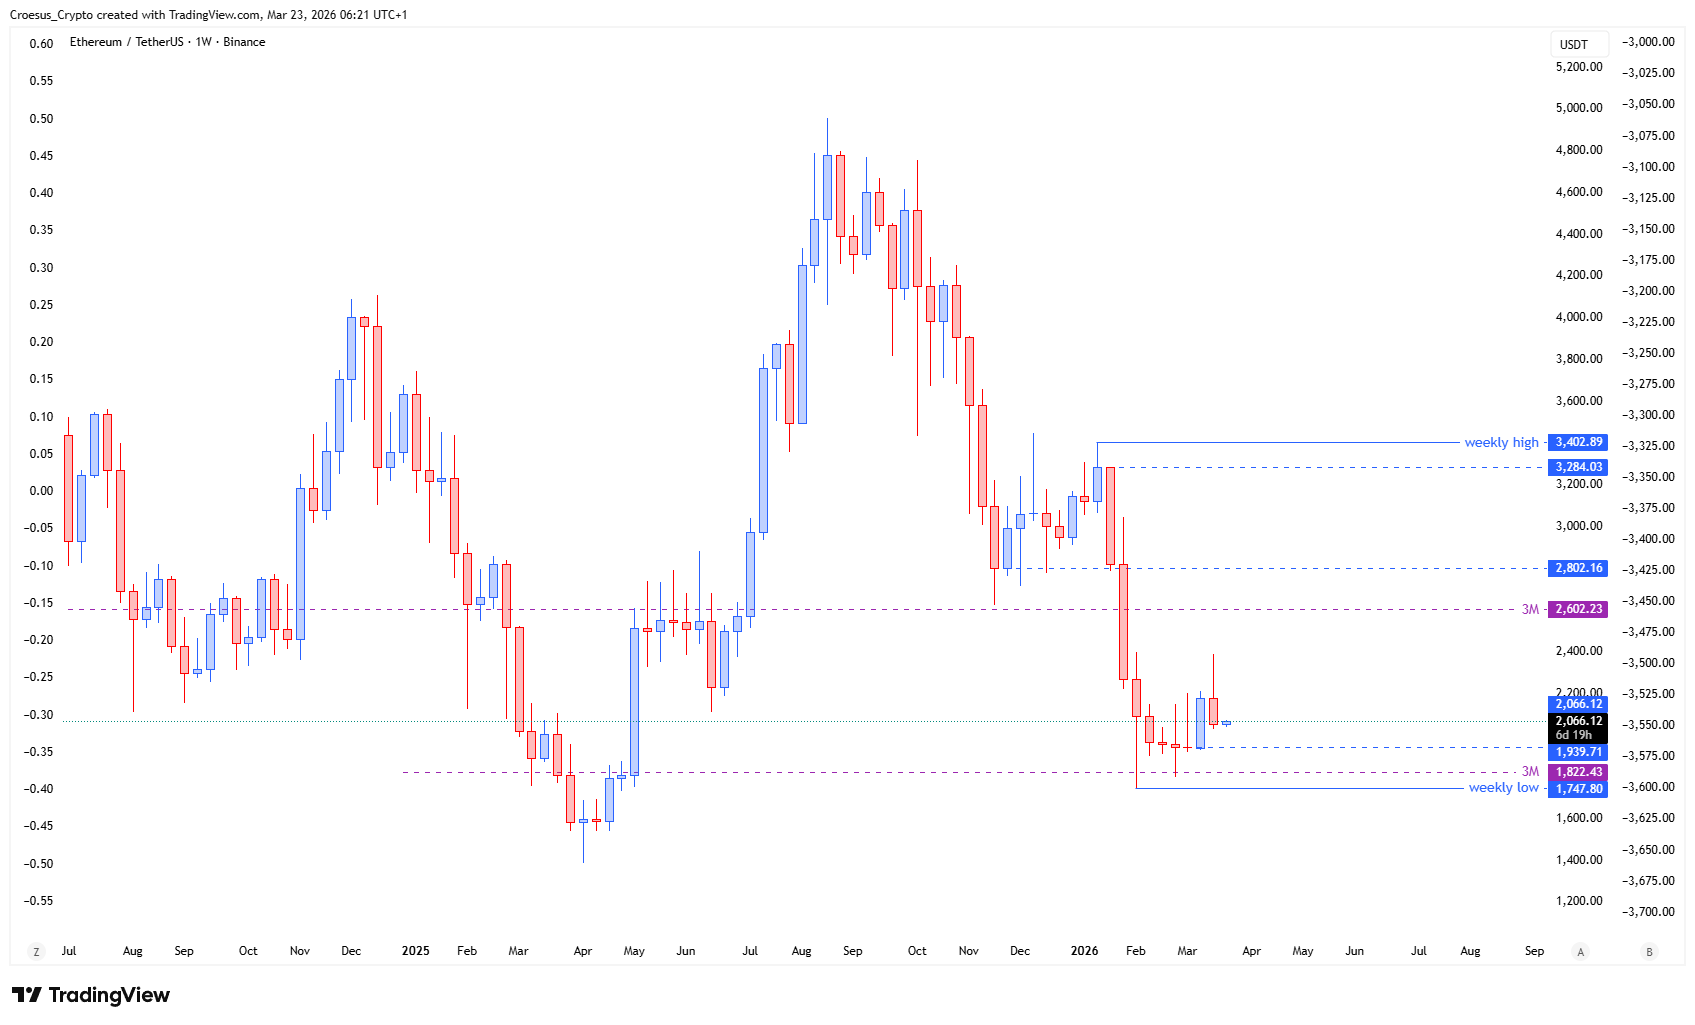
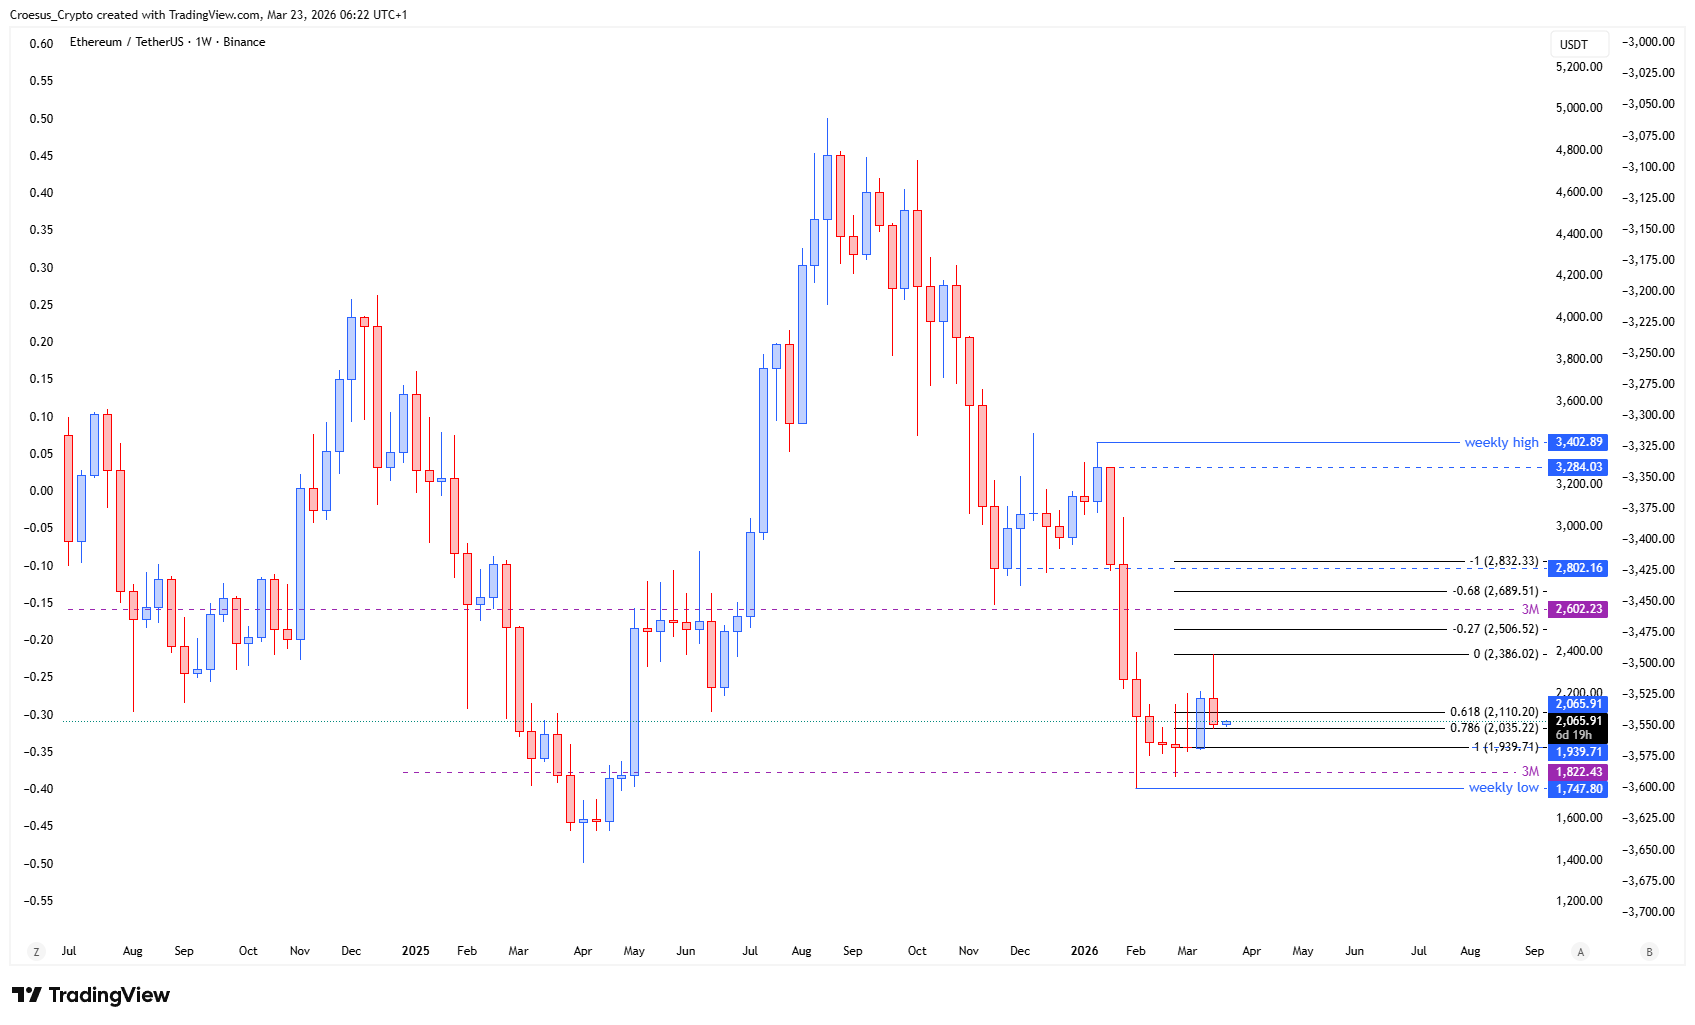
- The relief of the ETH price was capped at the prior lows, followed by a pullback towards the 0.786 retracement level.
- If the ETH price achieves to maintain this level, we could see a further bullish relief rallye the -0.27, -0.68 or even the -1 level.
- But do remain cautious : this bullish move remains a corrective move within a larger bearish impulse. Take profits on the noted levels and treat this move as a countertrend move, until proven otherwise.
Market Structure Analysis
Structurally, ETH is still trading inside a bearish impulse, and the recent upside attempt reads as a countertrend reaction rather than a confirmed reversal. The relief being capped at the prior lows highlights a classic support resistance flip: former support now acts as resistance, keeping the market pressured below a key horizontal ceiling. The pullback into the 0.786 retracement level is the current pivot for this corrective structure—if buyers can defend that zone, price can extend the relief leg higher, but the context remains a corrective sequence until ETH reclaims and holds above the prior-low resistance with strength. This ETH weekly analysis therefore prioritizes clean structure: reaction at reclaimed levels matters more than chasing upside in a bearish environment.
Key Levels and Scenarios
Bullish relief continuation requires ETH holding the 0.786 retracement level and building a higher low from that area. Any upside is treated as corrective unless ETH can reclaim the prior lows decisively. If the 0.786 level fails, bearish continuation risk increases as the broader impulse resumes.
- Prior lows: key resistance area that capped the relief move (support resistance flip)
- 0.786 retracement level: current corrective support that must hold for continuation
- -0.27 level: first upside objective within the relief structure
- -0.68 level: secondary upside objective if momentum persists
- -1 level: extended relief target, still countertrend within the larger bearish impulse
Trading Implications
In a bearish PHASE 1 environment, aggressive participants typically treat bounces as short-lived and manage exposure tightly around invalidation points, while conservative participants often wait for a reclaim of the prior lows before assigning reversal odds. Our ETH daily analysis remains focused on respecting resistance overhead and treating any rally into the noted levels as a countertrend move until structure proves otherwise.
This analysis is for informational purposes only and does not constitute financial advice.