

ETH Marketcap / Ethereum
ETH weekly analysis Week15 2026. Ethereum is still framed within a bearish context, but last week’s close introduces an important inflection: buyers managed to print a bullish weekly candle and close above a key weekly level, creating a potential shift in short-term positioning.
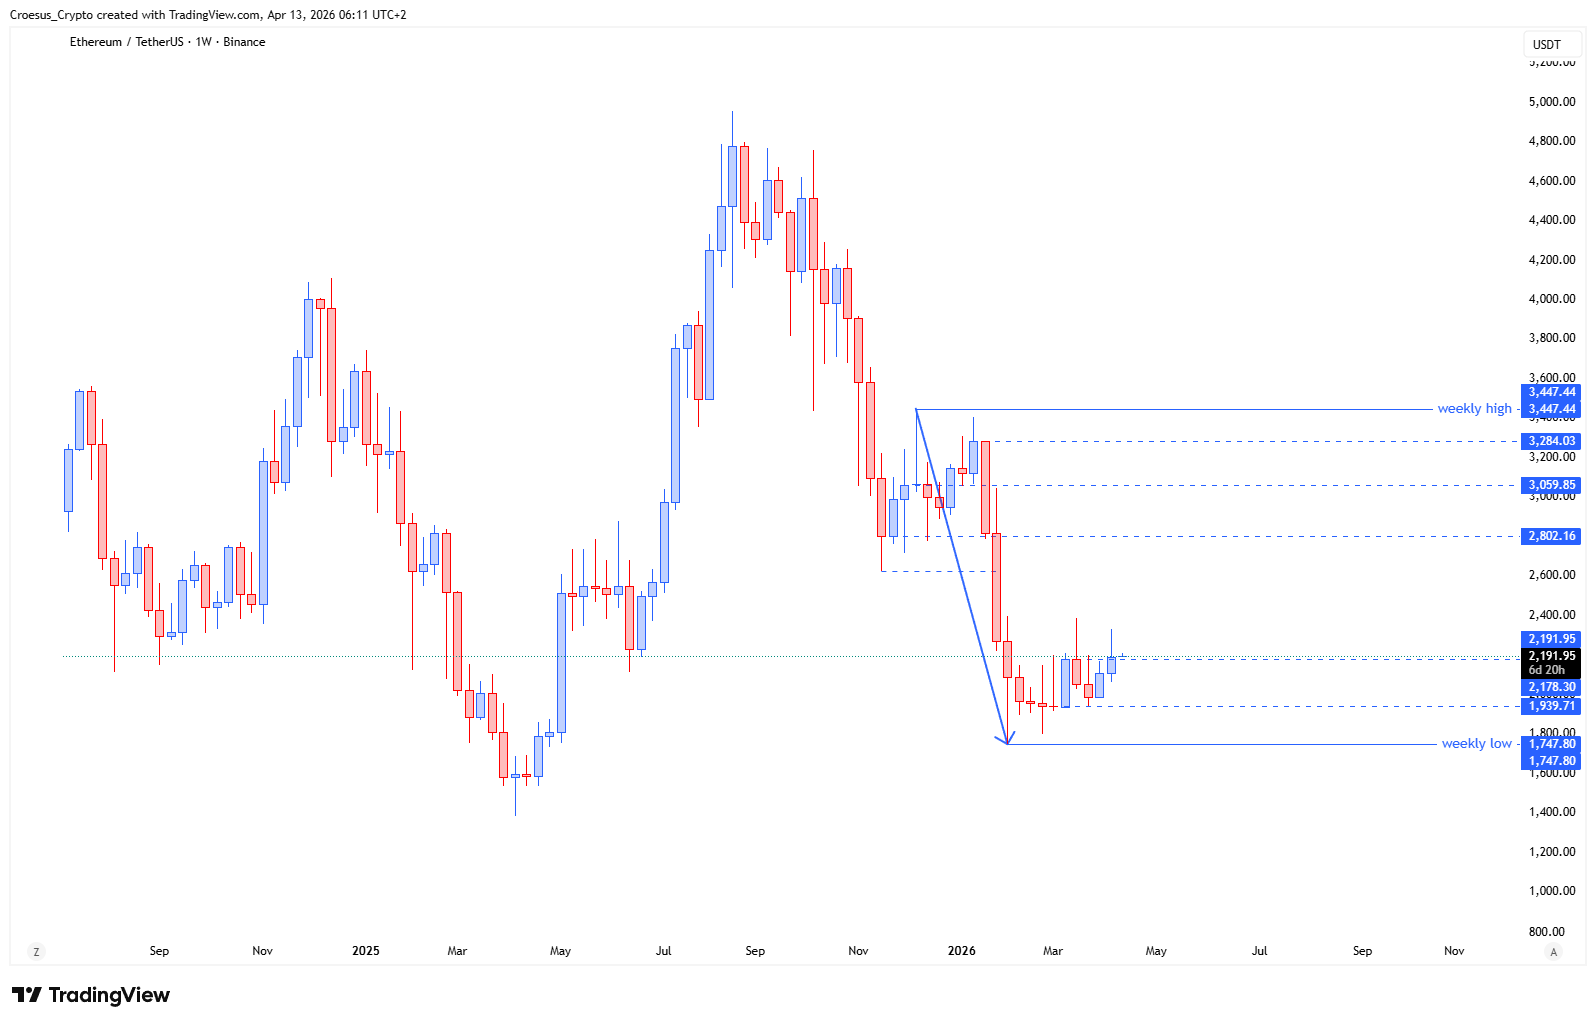
- ETH price shows us that last week's candle printed a bullish candle, that, other than with TOTAL and BTC, closed above the weekly level.
- Could ETH be front running and showing the way for the others to follow ? Or is this a simple fake-out, bringing the price back into the range ?
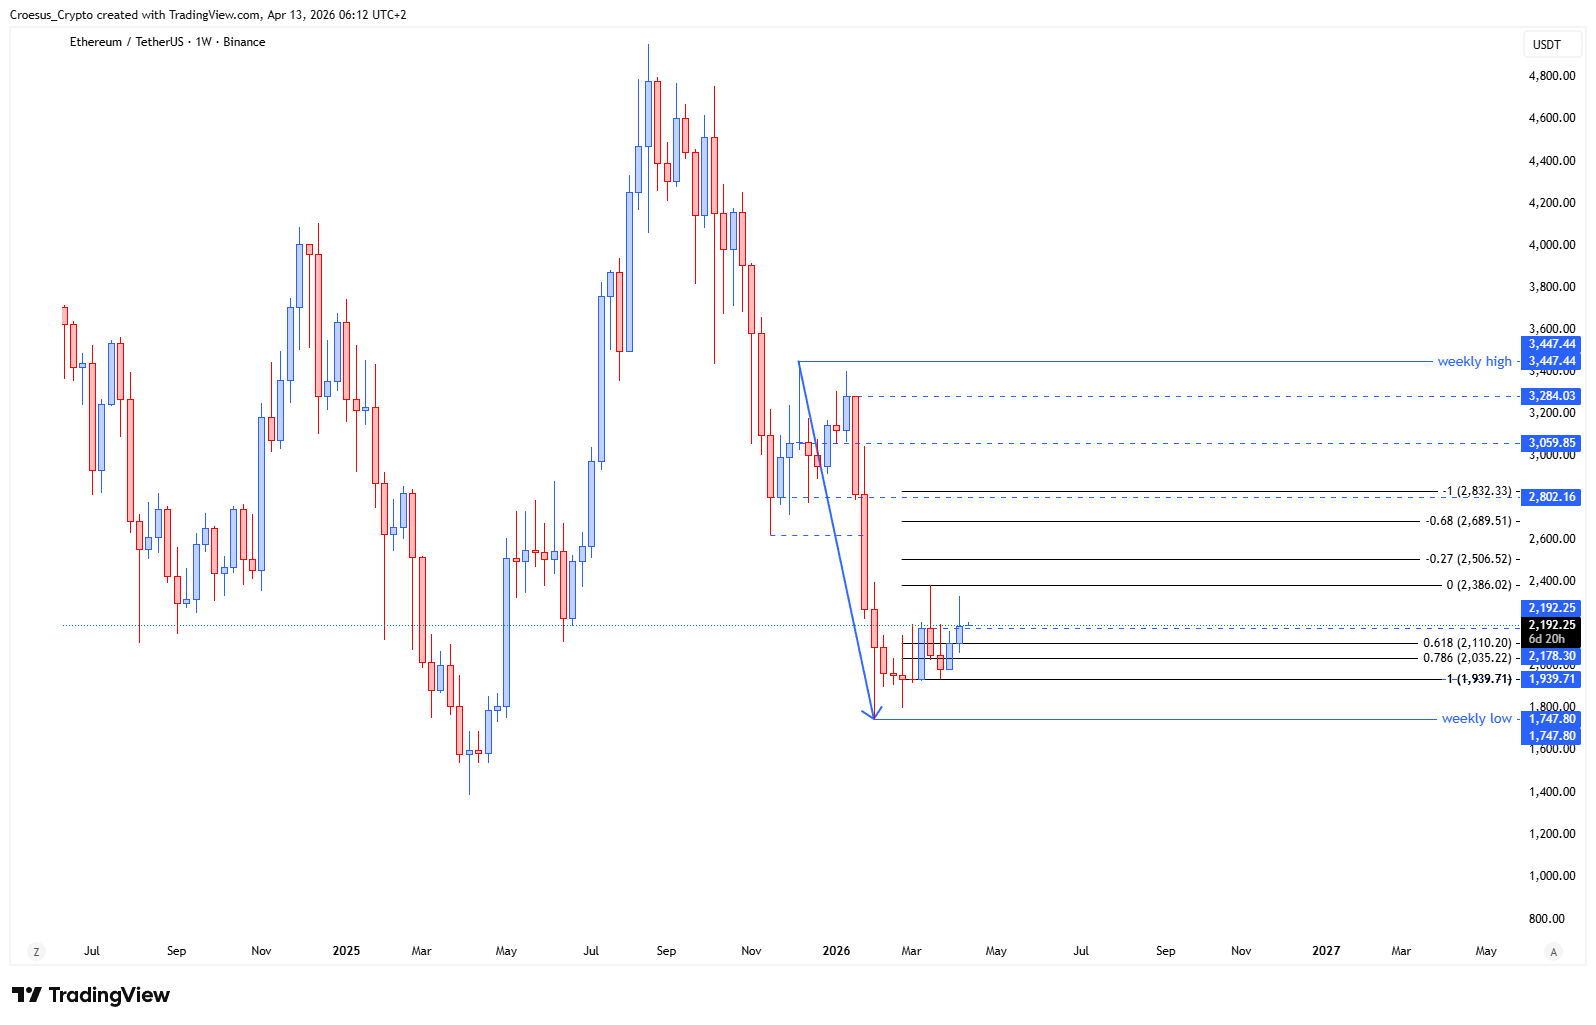
Market Structure Analysis
From a market structure perspective, our ETH weekly analysis focuses on the reclaim attempt of the weekly level. In a bearish PHASE 1 corrective phase, bullish weekly candles can either mark the start of a broader corrective retracement (relief move) or become a classic fake-out that briefly reclaims resistance before rotating back into the prior range.
The key detail is acceptance: if price holds above that reclaimed weekly level and builds higher structure (higher lows on the pullback), the move has room to develop as a corrective advance. If price fails to hold, the reclaim becomes a liquidity event where late buyers are trapped and price returns to range behaviour, keeping the broader bearish structure intact.
Key Levels and Scenarios
ETH weekly analysis remains scenario-driven here. Bullish follow-through requires sustained acceptance above the weekly level, turning it into support resistance structure that buyers can defend on retests. Bearish continuation is favoured if price rejects the weekly level after the reclaim and rotates back into the range, signalling the move was corrective only.
- The reclaimed weekly level as the main pivot for acceptance vs rejection
- The prior range boundaries as the immediate framework for continuation or rotation
- The most recent weekly swing structure (high/low) as confirmation for break of structure or failure
Trading Implications
Given the bearish trend and PHASE 1 context, aggressive positioning typically depends on fast confirmation around the weekly pivot, while more conservative traders usually wait for either a clean retest-and-hold above the level or a clear rejection back into the range. Risk is elevated while the market decides whether the reclaim is real.
This analysis is for informational purposes only and does not constitute financial advice.