ETH Marketcap / Ethereum
ETH weekly analysis Week 17 2026. Ethereum remains in a corrective pullback on the weekly timeframe, where last week’s bullish close is met with clear rejection wicks, signalling active selling pressure at that area.
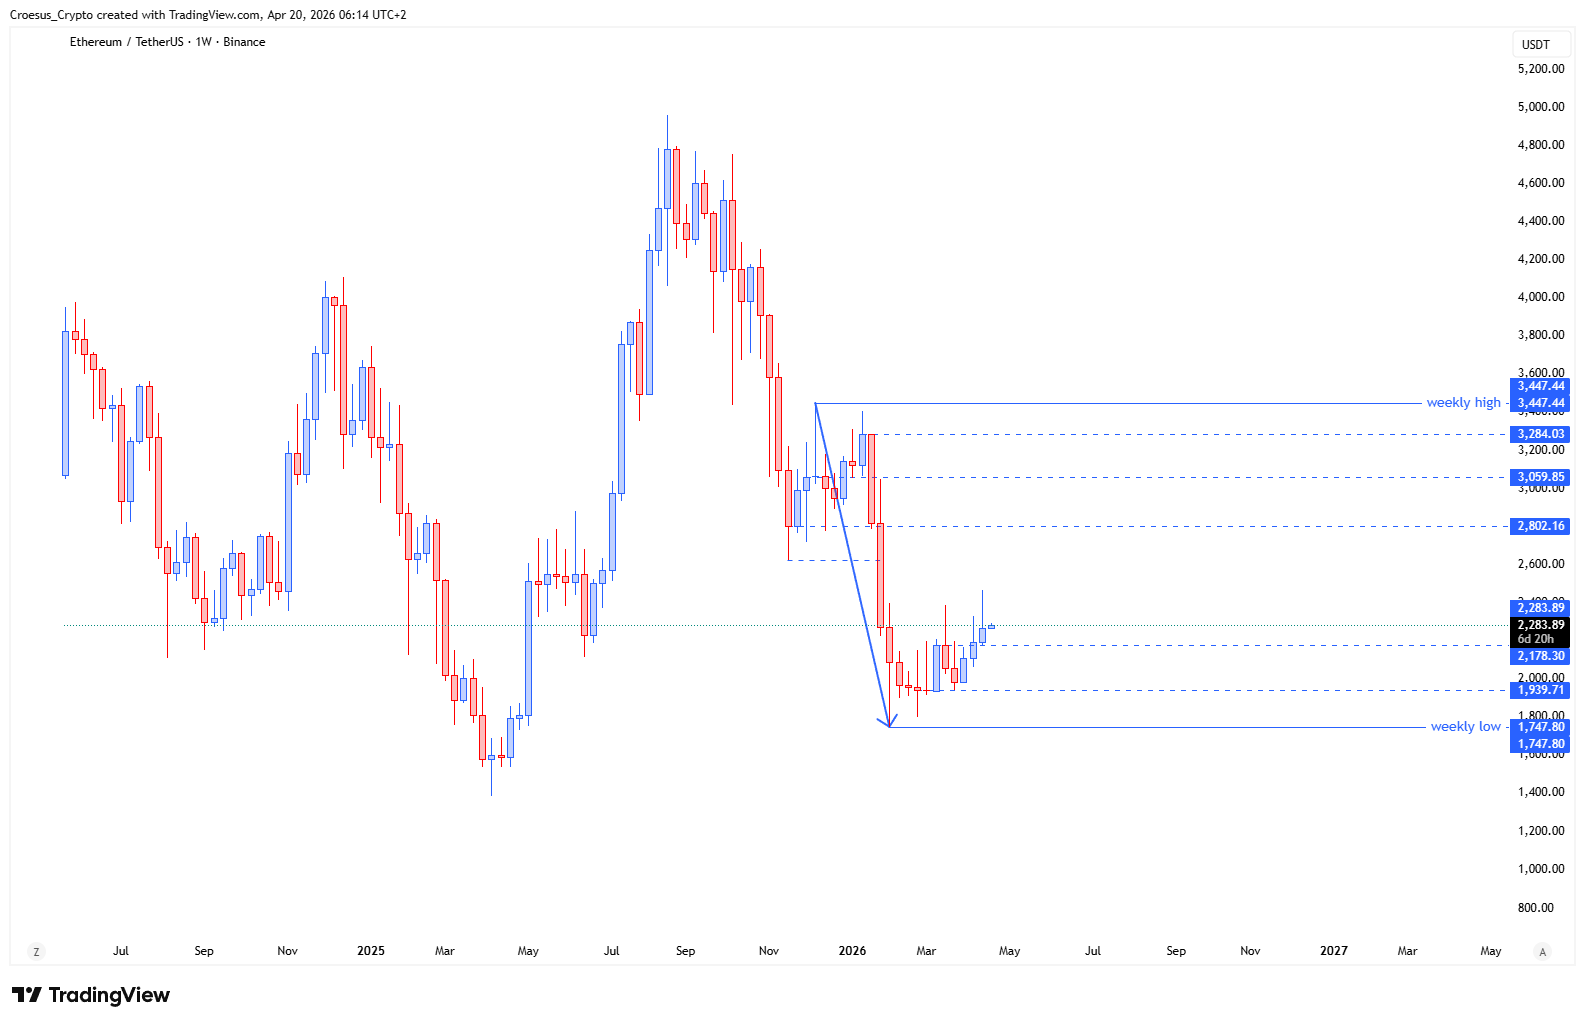
- ETH price shows us that last week's candle printed a bullish candle, but the rejection wicks shows us that bears are defending that area.
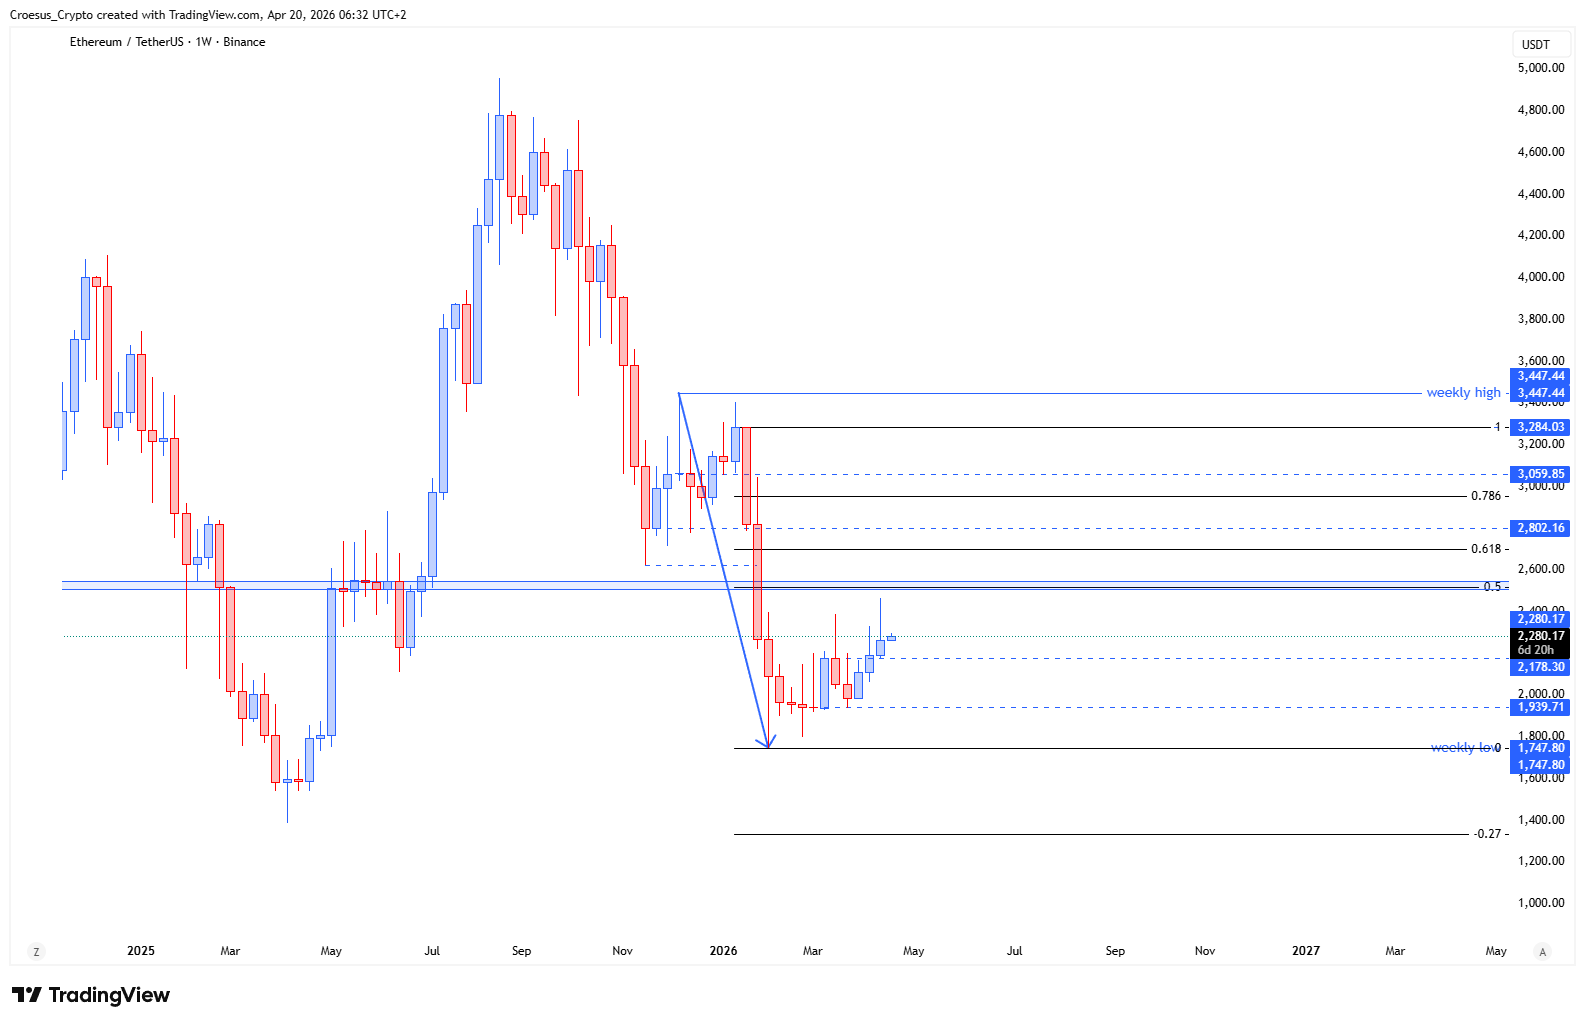
- Other than TOTAL and BTC, ETH did not touch the 0.5 fib retracement level yet. At that level there is a major weekly buy and sell zone. We might expect a bullish push this week into that level, but we need to see a clear break and hold of that zone, in order to speak of bullish continuation.
Market Structure Analysis
From a market structure perspective, ETH is still behaving like a bearish corrective phase: buyers managed to print a bullish weekly candle, but the upper rejection wicks show supply overhead and a defended resistance zone. That wick behaviour typically reflects a liquidity response into highs rather than clean acceptance above them. Our ETH weekly analysis also highlights an important missing retracement compared to BTC and TOTAL: ETH has not yet tagged the 0.5 Fibonacci level, which aligns with a major weekly buy/sell zone. In naked trading terms, that area becomes the next obvious support resistance inflection point: if price pushes into it and fails to hold (rejection and weak closes), the correction remains dominant; if price breaks and holds above it (acceptance), it improves the odds of a broader recovery leg.
Key Levels and Scenarios
Bearish continuation remains the base case while ETH struggles to show acceptance above the defended wick zone. A bullish push into the 0.5 Fibonacci retracement is plausible, but bullish continuation only becomes credible after a clear break and hold above that weekly buy/sell zone.
- Last week’s rejection-wick area as the near-term resistance sellers are defending
- The 0.5 fib retracement level as the key decision point for acceptance vs rejection
- The major weekly buy and sell zone at the 0.5 retracement as the primary breakout/hold requirement
Trading Implications
In this ETH weekly analysis, the cleanest approach is to let structure confirm direction: aggressive traders often watch for rejection signals at resistance, while conservative traders typically wait for a confirmed break-and-hold above the 0.5 Fibonacci zone before treating any rally as more than a corrective bounce.
This analysis is for informational purposes only and does not constitute financial advice.