ETH Marketcap / Ethereum
ETH weekly analysis week 17 April 2026. Ethereum is printing a corrective push higher inside a broader bearish context, and our technical analysis focuses on whether this bounce is losing momentum at resistance or simply consolidating before another leg up within the correction.
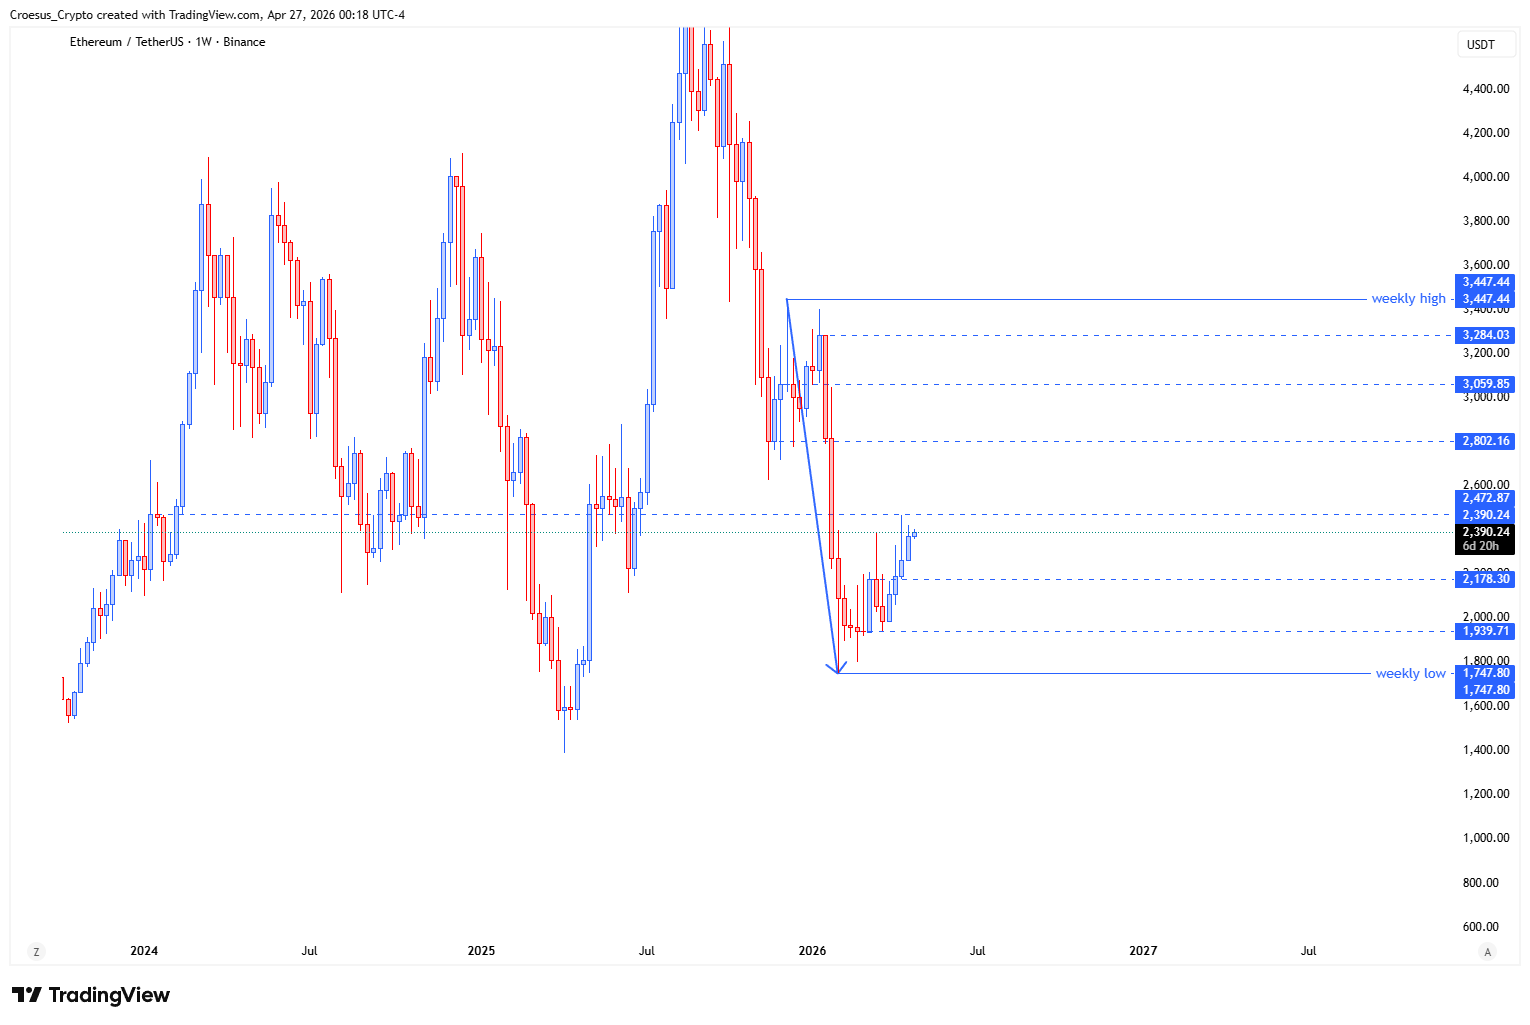
- ETH price shows us the price pushed higher but failed to close above the wick of the prior candle
- Does this show a sign of cooling down of the impulse of rather a consolidation before pushing higher ?
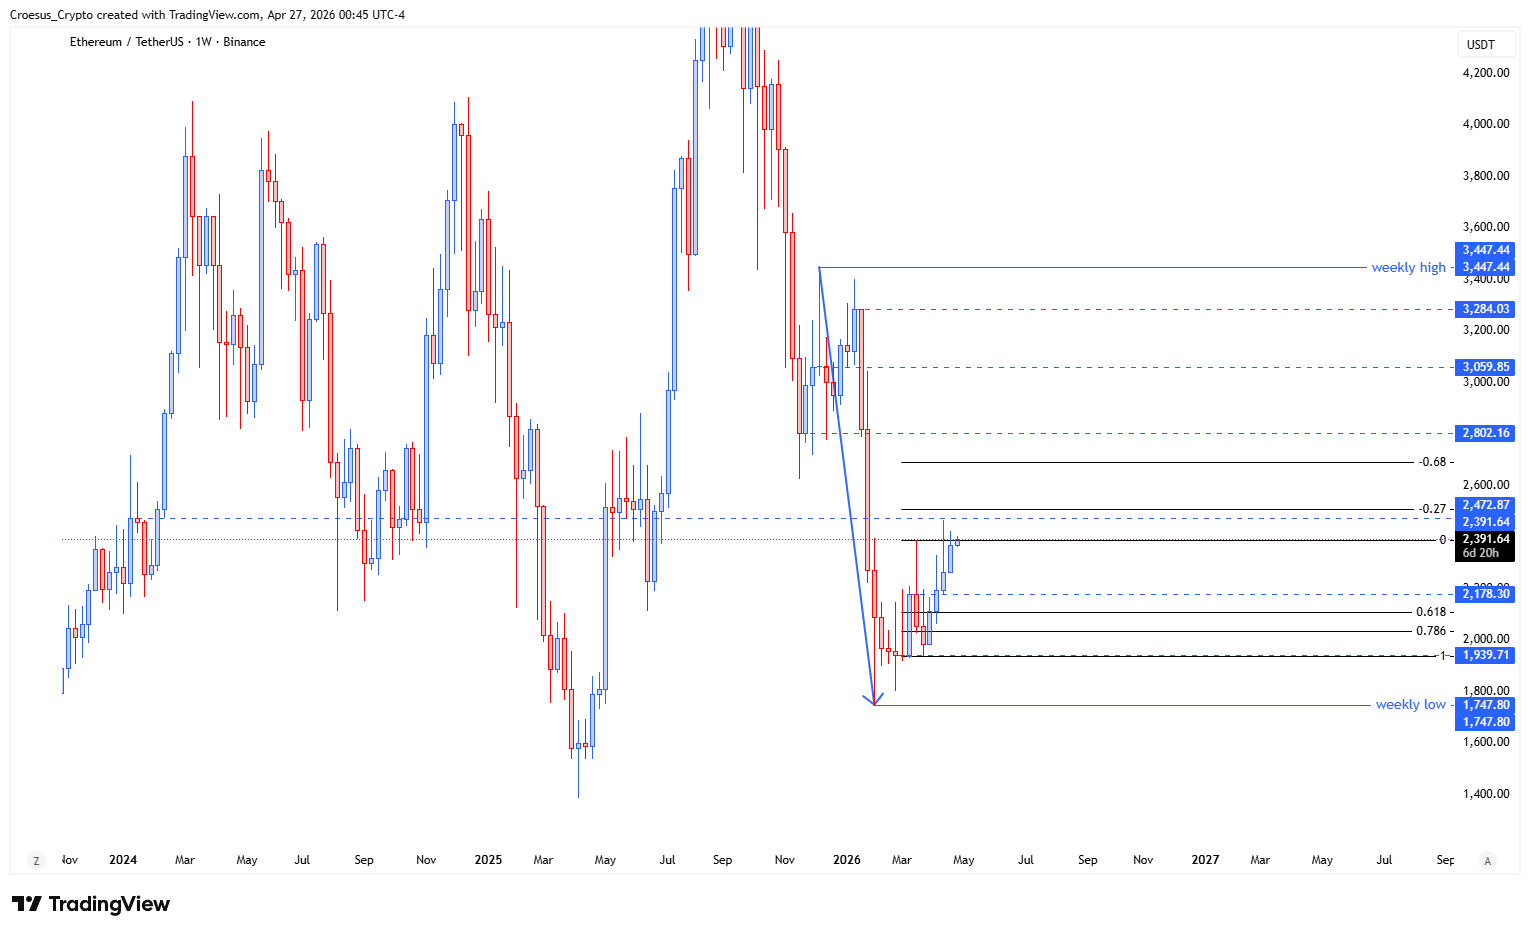
- As the fib -0.27 level of the first leg up is not touched yet, we could expect a sweep of the local high followed by a retracement. That would be a healthy move in order to find extra liquidity to continue the correction.
- Eventhough this move is bullish at this moment, we still have to consider that we are experiencing a bullish correction of a bearish impulse. In a broader picture, we are still bearish.
Market Structure Analysis
From a market structure standpoint, ETH remains in a bearish environment, with the current move best read as a bullish correction of a prior bearish impulse. The failed close above the prior candle’s wick highlights nearby supply and suggests that upside follow-through is not yet confirmed. In Croesus “naked trading” terms, this is a key support resistance reaction: price pushes into a reference high, but cannot accept above it. With the fib -0.27 of the first leg up still not tapped, our ETH daily analysis keeps the “liquidity sweep” scenario in play—price can run the local high to capture stops, then retrace to rebalance and build a cleaner corrective structure.
Key Levels and Scenarios
Bullish continuation inside the correction would be supported by acceptance above the prior wick high after any sweep. Bearish continuation on the higher timeframe remains the main thesis if the corrective structure fails and price starts breaking back down through recent supports.
- Prior candle wick high (key resistance / acceptance trigger)
- Local high (potential liquidity sweep zone)
- fib -0.27 level of the first leg up (magnet level not yet tagged)
- Recent corrective base (structure support; failure shifts bias back to the bearish impulse)
This analysis is for informational purposes only and does not constitute financial advice.