

ETH Marketcap / Ethereum
ETH weekly analysis week 4 January 2026. Ethereum is trading back into a key demand area as price retests the weekly lows, with the current structure showing a potential corrective completion but still leaving room for a deeper sweep before reversal.
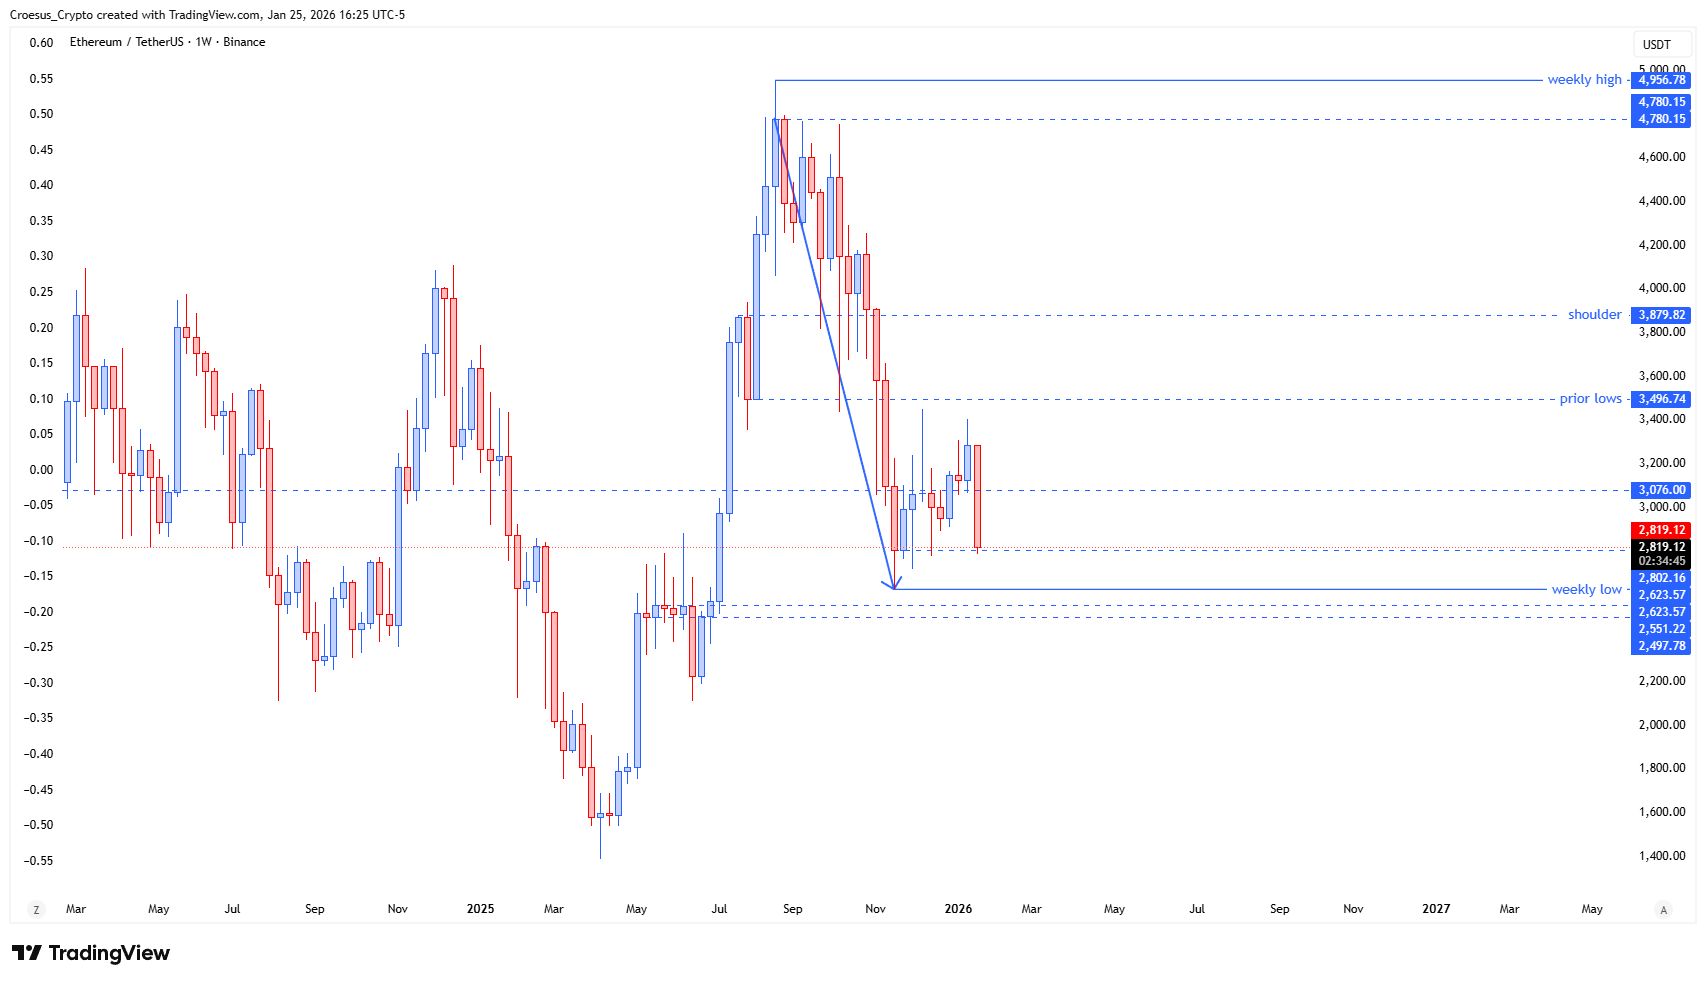
- Same here : retest of the weekly lows.
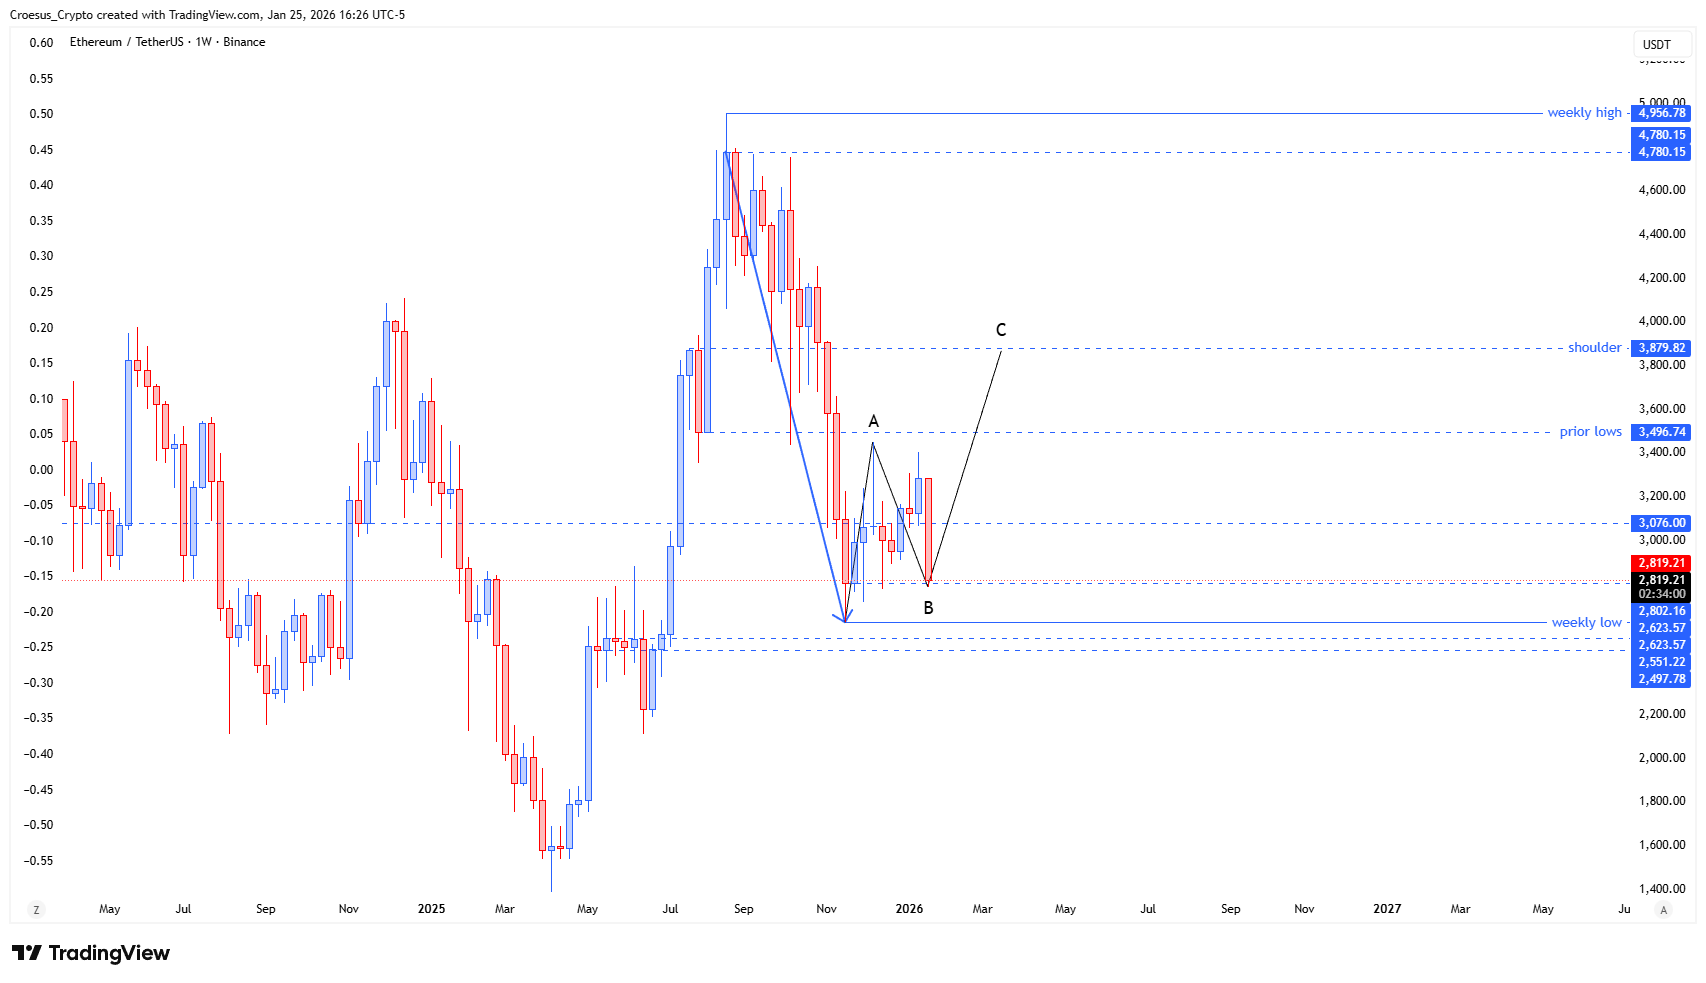
- But also here : this sweep of the lows still fits in a possible ABC-correction and even can push lower in the fake out, as there still remain some untested lows there.
- Point of invalidation of this set-up is the weekly swing low @2.623,57 USDT
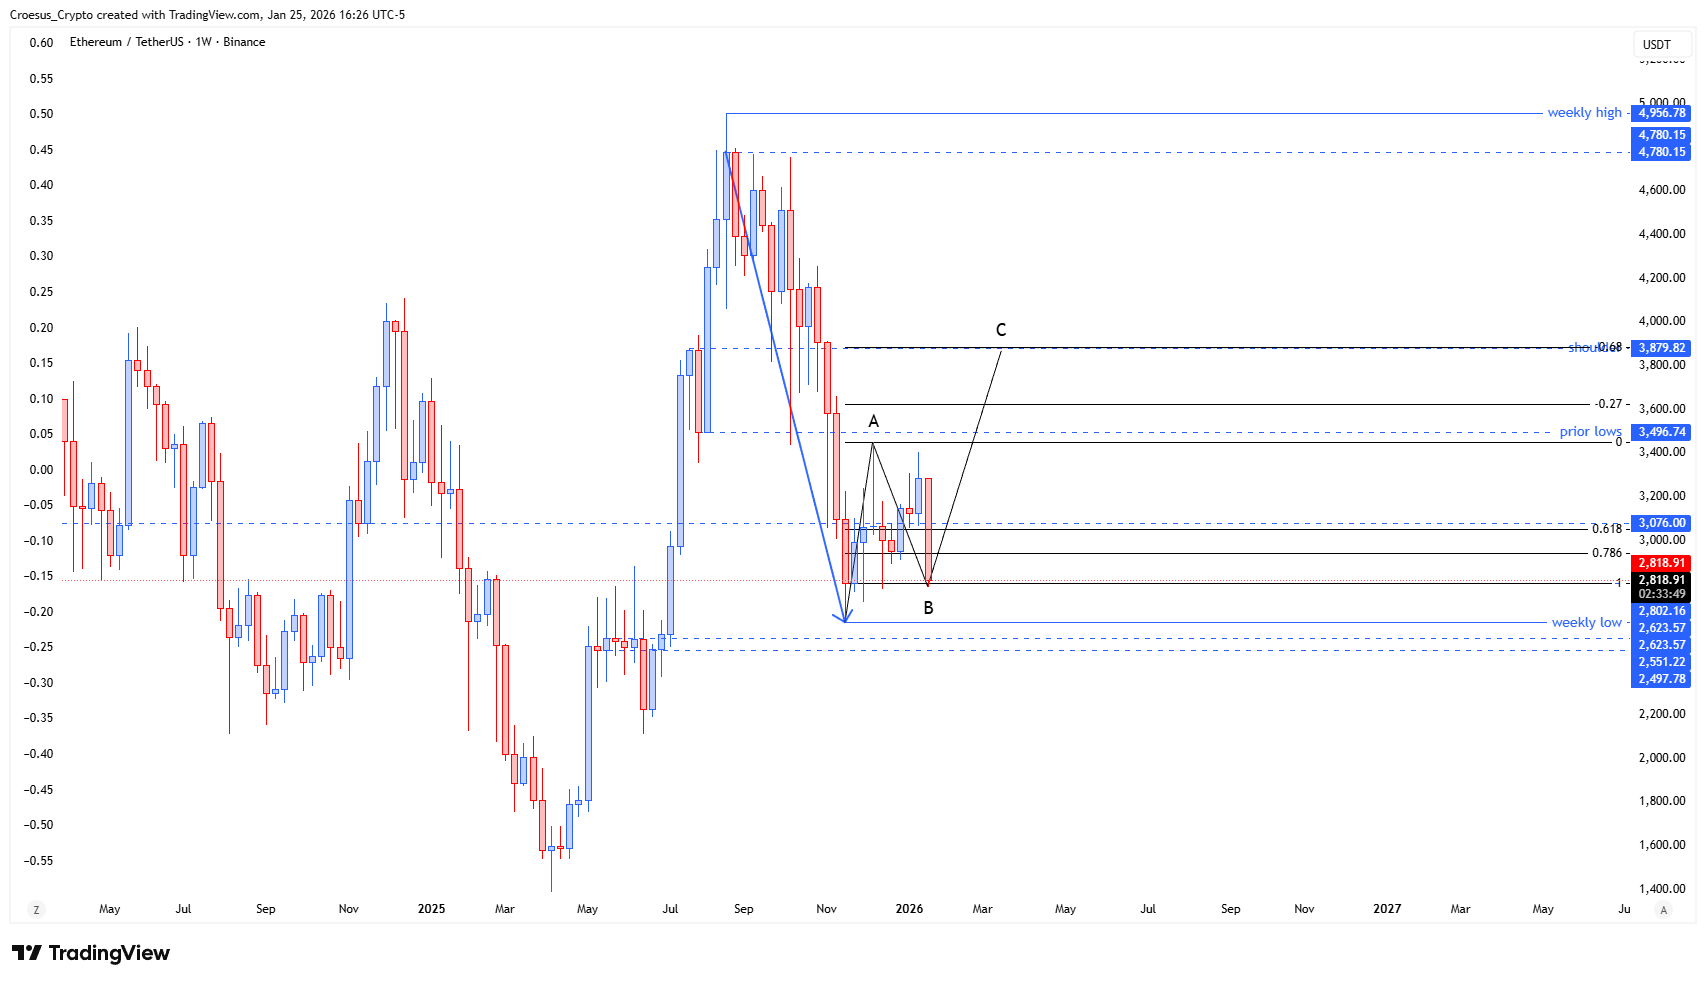
- If the ABC correction plays out successfully, we could see the price surge towards the fib level -0.68 of the A-leg of the ABC-correction which coincides with the shoulder level of the larger H&S pattern.
Market Structure Analysis
From a market structure perspective, ETH is pressing into prior weekly support resistance where liquidity typically pools below obvious lows. Our ETH weekly analysis focuses on whether this move is a clean reclaim from weekly demand or a “fake out” sweep that taps remaining untested lows before shifting direction.
The invalidation is clearly defined at the weekly swing low @2.623,57 USDT, which acts as the structural line in the sand. If price holds above that swing low and the ABC correction completes, the next meaningful upside reference becomes the fib level -0.68 of the A-leg, aligning with the shoulder level of the larger H&S pattern—an area that often acts as a decision zone for continuation vs. rejection.
Key Levels and Scenarios
Bullish continuation in this ETH weekly analysis requires defending the weekly low region without losing the defined swing-low invalidation, then reclaiming structure as the correction resolves. Bearish continuation remains valid if price sweeps lower into the untested lows and fails to reclaim prior support resistance cleanly.
- Weekly swing low @2.623,57 USDT: invalidation point for the set-up
- Weekly lows zone: current support area being retested
- Untested lows below: potential liquidity sweep / fake out extension zone
- Fib level -0.68 of the A-leg: upside reference if the ABC correction completes
- Shoulder level of the larger H&S pattern: confluence resistance/target area
Trading Implications
The current location offers a defined structural framework: aggressive participants typically focus on confirmation around weekly demand, while conservative participants wait for a clear reclaim and follow-through away from the lows. Risk remains elevated while price is still interacting with potential sweep liquidity.
This analysis is for informational purposes only and does not constitute financial advice.