

ETH weekly chart – Week 47 2025 with bearish continuation into confluent 3M, Monthly and Weekly support around 2,600–2,500 and upside key levels at 3,500, 3,900, 4,150 and 4,500
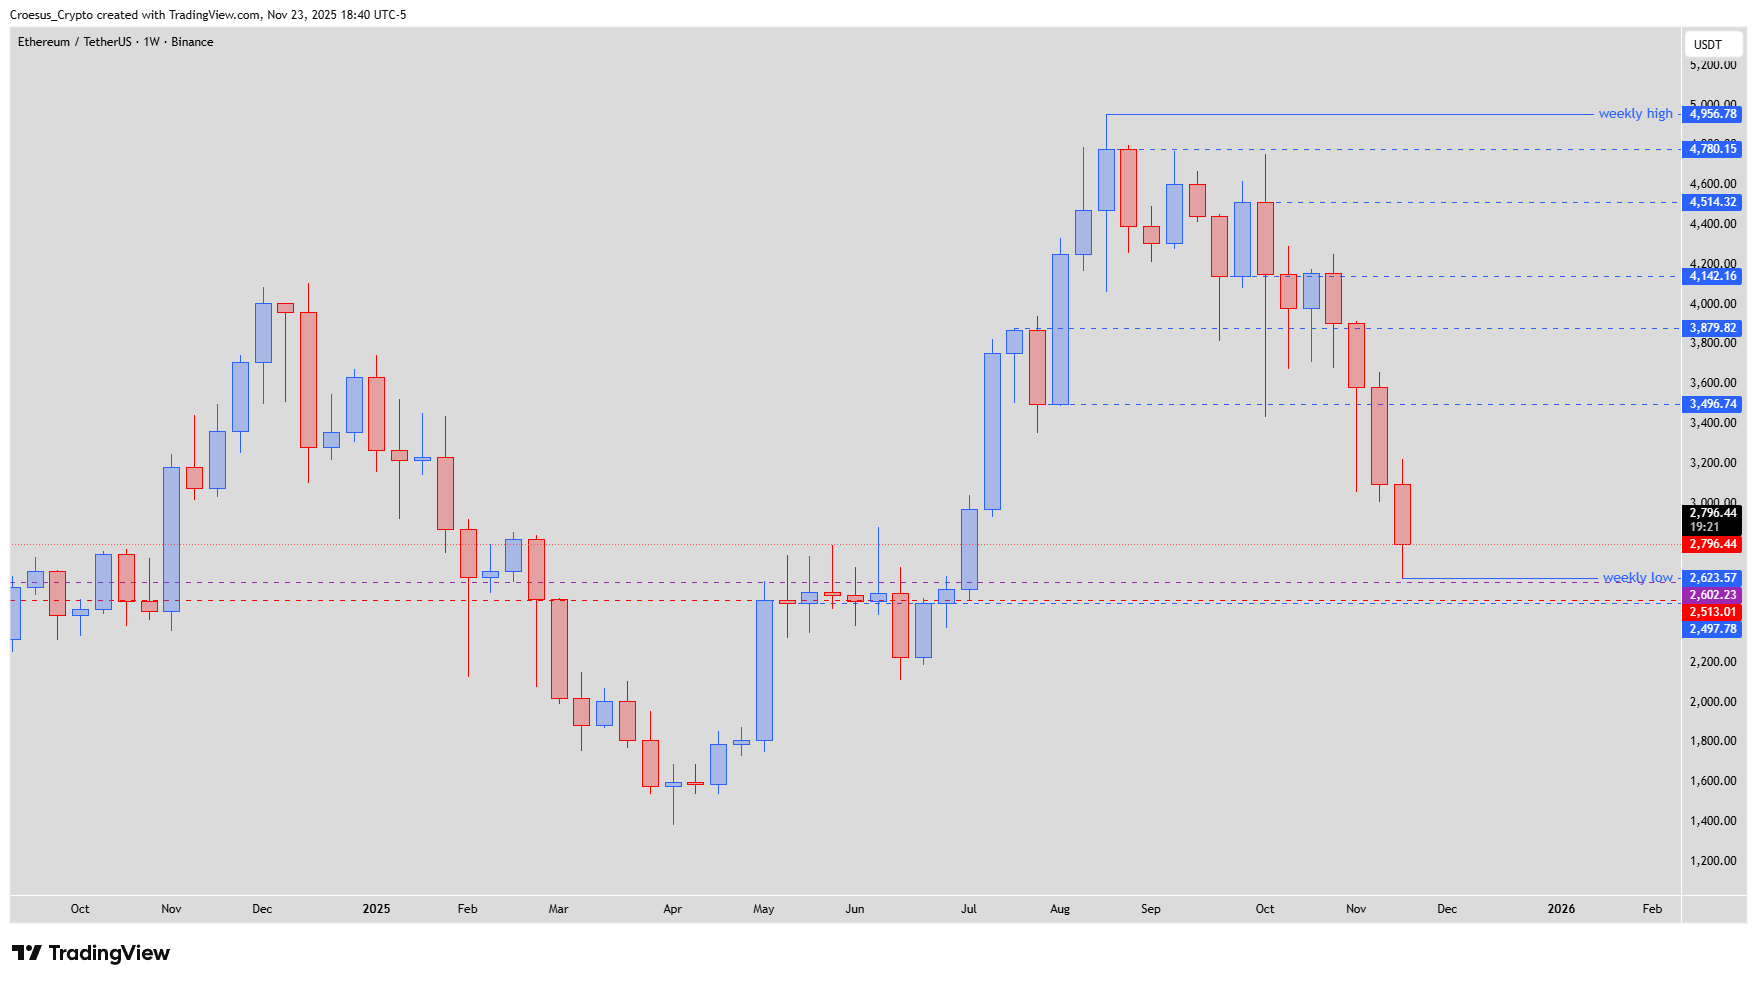
In this ETH weekly analysis for Week 47 of November 2025, Ethereum extends its bearish leg without any meaningful response from buyers. Our technical analysis highlights how price is now grinding down toward a stacked 3M level at 2,602 $ and a confluent Monthly and Weekly zone around 2,500 $, a potential higher-timeframe support area where a reaction could finally emerge.
Technical Analysis Key Points
- The bulls clearly had nothing to say this week. A bearish continuation took place.
- Price is approaching a 3M level @ 2,602 $ and a confluent M and W level around 2,500 $. When higher timeframe are confluent, this could act as a support level and show us potential reversal on the lower timeframes, when hit.
- We have to remain patient until the levels are hit and/or we see clear signs of reversal on the lower timeframes
- Note that any bullish activity needs to treated as a correction of the last bearish leg down. Taking take profits at key levels @ 3,500 $ / 3,900 $ / 4,150 $ / 4,500 $ is adviced. No one ever died of taken some profit of the table.
Market Structure Analysis
This ETH weekly analysis shows a clean series of lower highs and lower lows after the prior top, with the latest candle extending the bearish momentum. There is currently no visible weekly slowdown or reversal pattern; instead, ETH is mechanically moving toward a clear support resistance cluster defined by the 3M level at 2,602 $ and the Monthly/Weekly zone near 2,500 $. When several higher timeframes align like this, they often form a decision area where either a corrective bounce or further breakdown will be defined. Even without explicit Fibonacci confluence on the chart, the structure alone marks this as a key inflection zone for swing traders.
Key Levels and Scenarios
Bullish (corrective) scenario: if price tags the 2,602–2,500 $ area and lower timeframes print a clear reversal, a relief move could unfold toward the first resistance band.
Key levels to watch:
2,602 $ – 3M level and first major support candidate
≈2,500 $ – confluent Monthly and Weekly support; core reversal zone
3,500 $ – first upside target; potential support resistance flip
3,900 $ – intermediate resistance during any relief rally
4,150 $ / 4,500 $ – extended corrective targets where a new bearish leg could start
Trading Implications
Any long positioning here should be treated strictly as countertrend, with entries only considered once support is actually hit and confirmed on lower timeframes, and with partial profit-taking planned at each resistance step to avoid getting trapped if the broader downtrend resumes.
This analysis is not financial advice; always do your own research and manage your risk before trading.