

ETH Marketcap / Ethereum
ETH weekly analysis week 5 January 2026. Ethereum is in a clear downside impulse on the weekly timeframe after an aggressive sell-off, and our ETH weekly analysis focuses on how the break of weekly lows interacts with key Fibonacci zones.
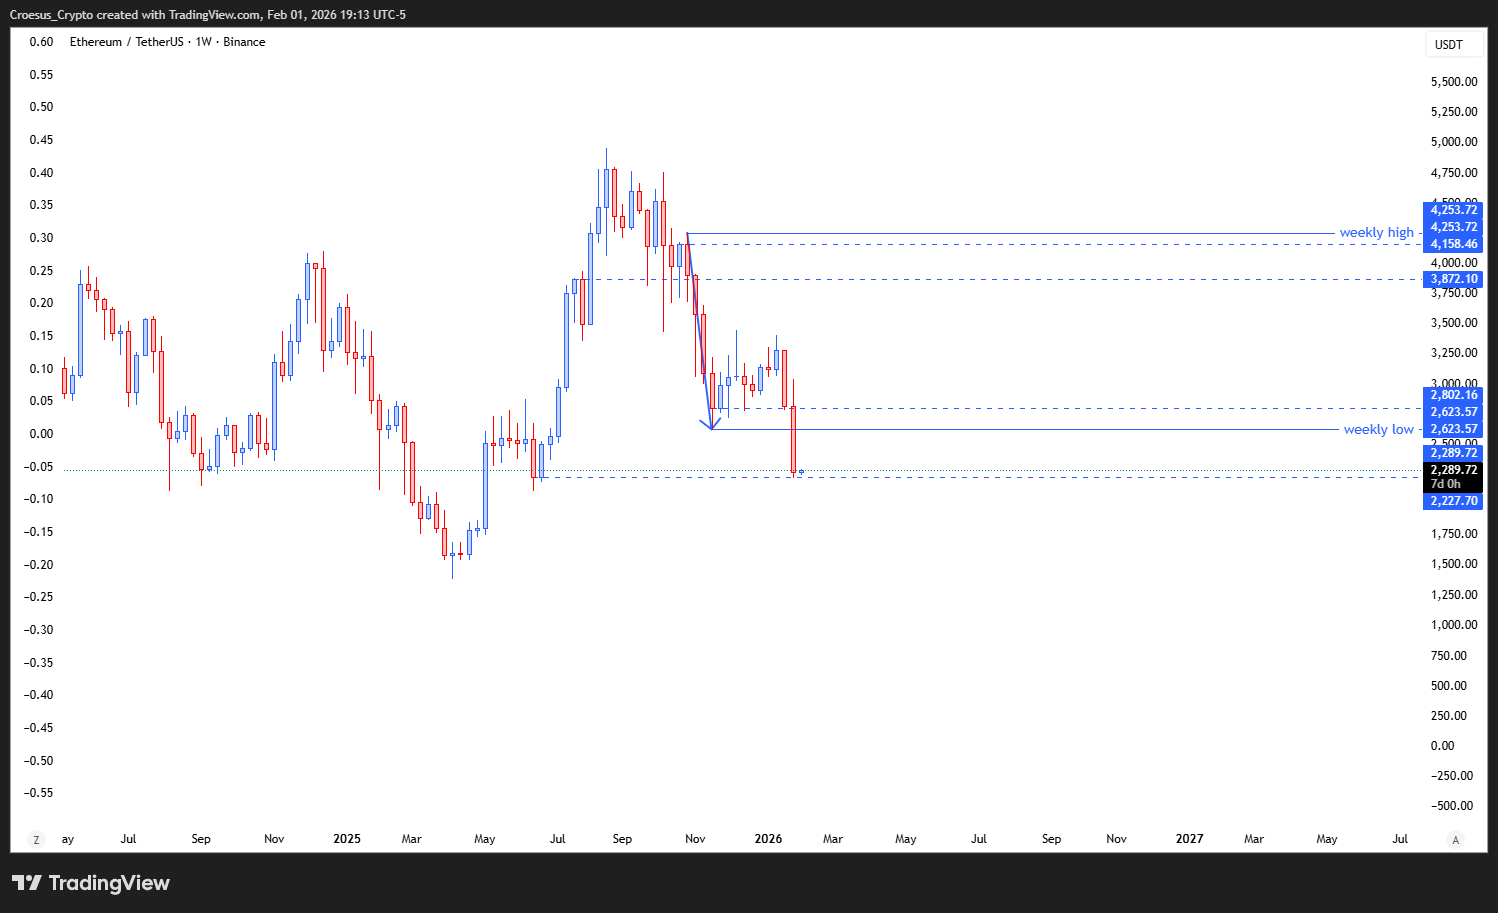
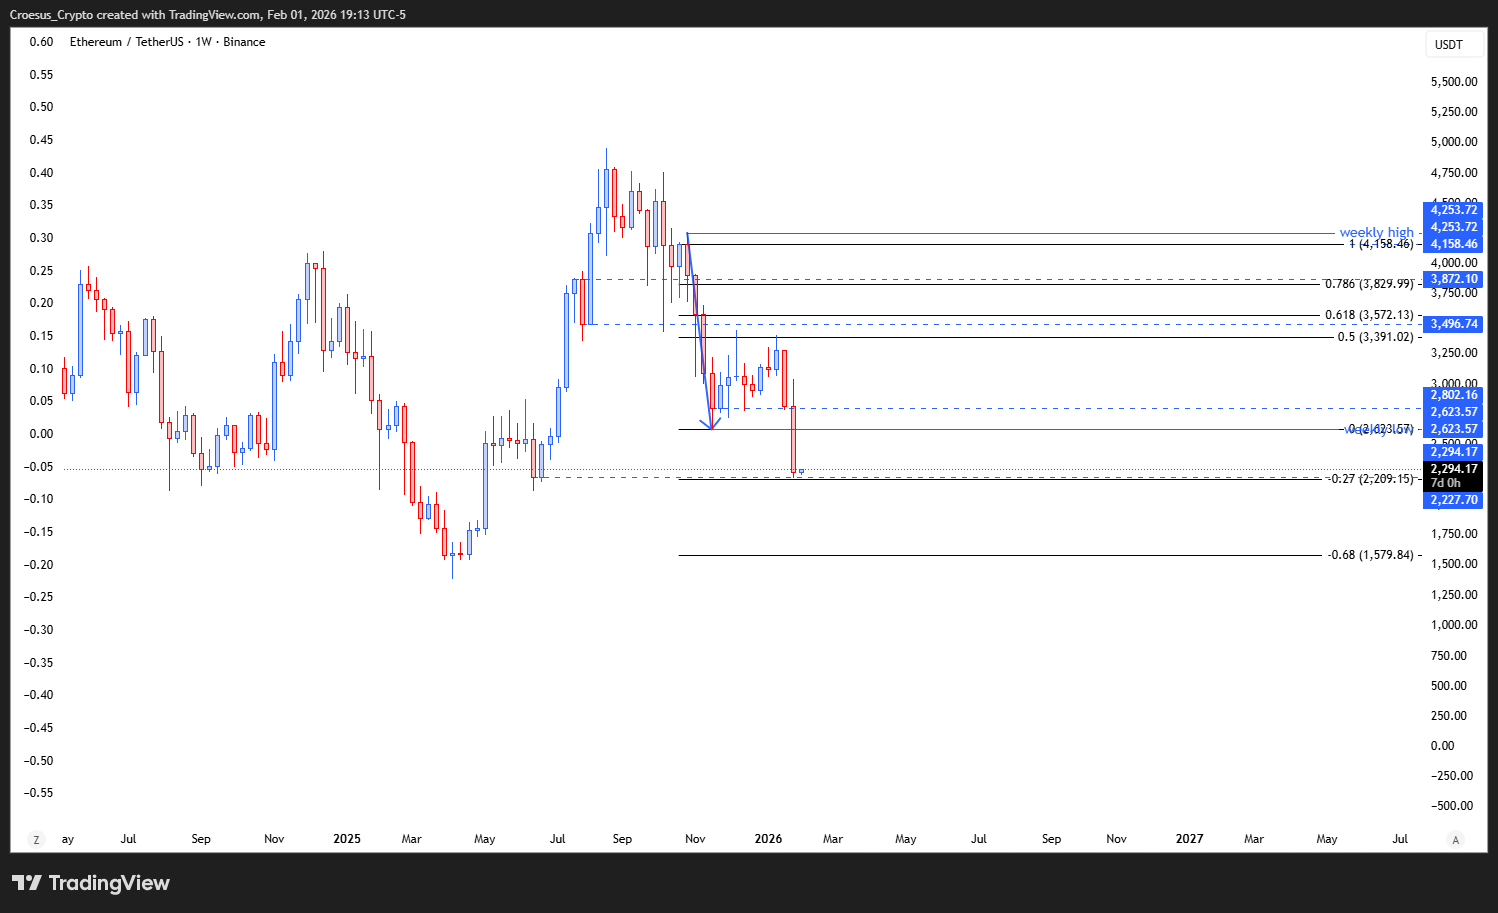
- ETH shows an aggressive sell-off breaking the weekly lows
- When we look at the fib retracement we can notice that the price only retraced until the 0.5 level, not touching the golden pocket between the 0.618 and the 0.786 level.
- As the weekly low has been broken, we look at the weekly target at the fib -0.27 to be completed. We just did not hit it. It did hit the weekly level exactly.
- Once the fib -0.27 gets activated we can expect a retrace towards the golden pocket.
Market Structure Analysis
With weekly lows breaking, ETH is printing a bearish market structure shift where prior support is no longer holding and liquidity below the range low is being explored. The Fibonacci detail is important here: the corrective rebound only reaches the 0.5 retracement, which keeps the move structurally “heavy” to the downside because price never rebalanced into the golden pocket (0.618–0.786).
In our ETH weekly analysis, that typically supports continuation until a clear downside objective is satisfied. The -0.27 extension is treated as the next structural target zone on the weekly chart, and the commentary around “just did not hit it” highlights that the market may still be working to complete that extension before a cleaner corrective leg develops.
Key Levels and Scenarios
Bearish continuation remains the base case while ETH trades below the broken weekly low and keeps failing to reclaim deeper retracement zones. A more meaningful bullish retrace scenario only becomes higher-probability if the -0.27 extension is “activated” and completion triggers a corrective response back toward premium Fibonacci supply.
- Broken weekly lows as primary resistance on any retest (support resistance flip)
- Fib 0.5 level as the current corrective ceiling referenced in the pullback
- Golden pocket between the 0.618 and the 0.786 level as the key retracement target zone
- Fib -0.27 as the weekly downside objective/extension to be completed
Trading Implications
This ETH weekly analysis suggests asymmetric risk around the broken-structure area: aggressive participants typically look for continuation confirmation under former support, while conservative participants often wait for the extension objective to complete and then evaluate whether the rebound into the golden pocket holds as a corrective move rather than a reversal.
This analysis is for informational purposes only and does not constitute financial advice.