

In this ETH weekly analysis for week 50 of 2025, we see price rejecting a higher-timeframe supply zone and closing the weekly candle as a swing failure. Our technical analysis suggests that ETH is more likely to search for liquidity lower before any sustained recovery.
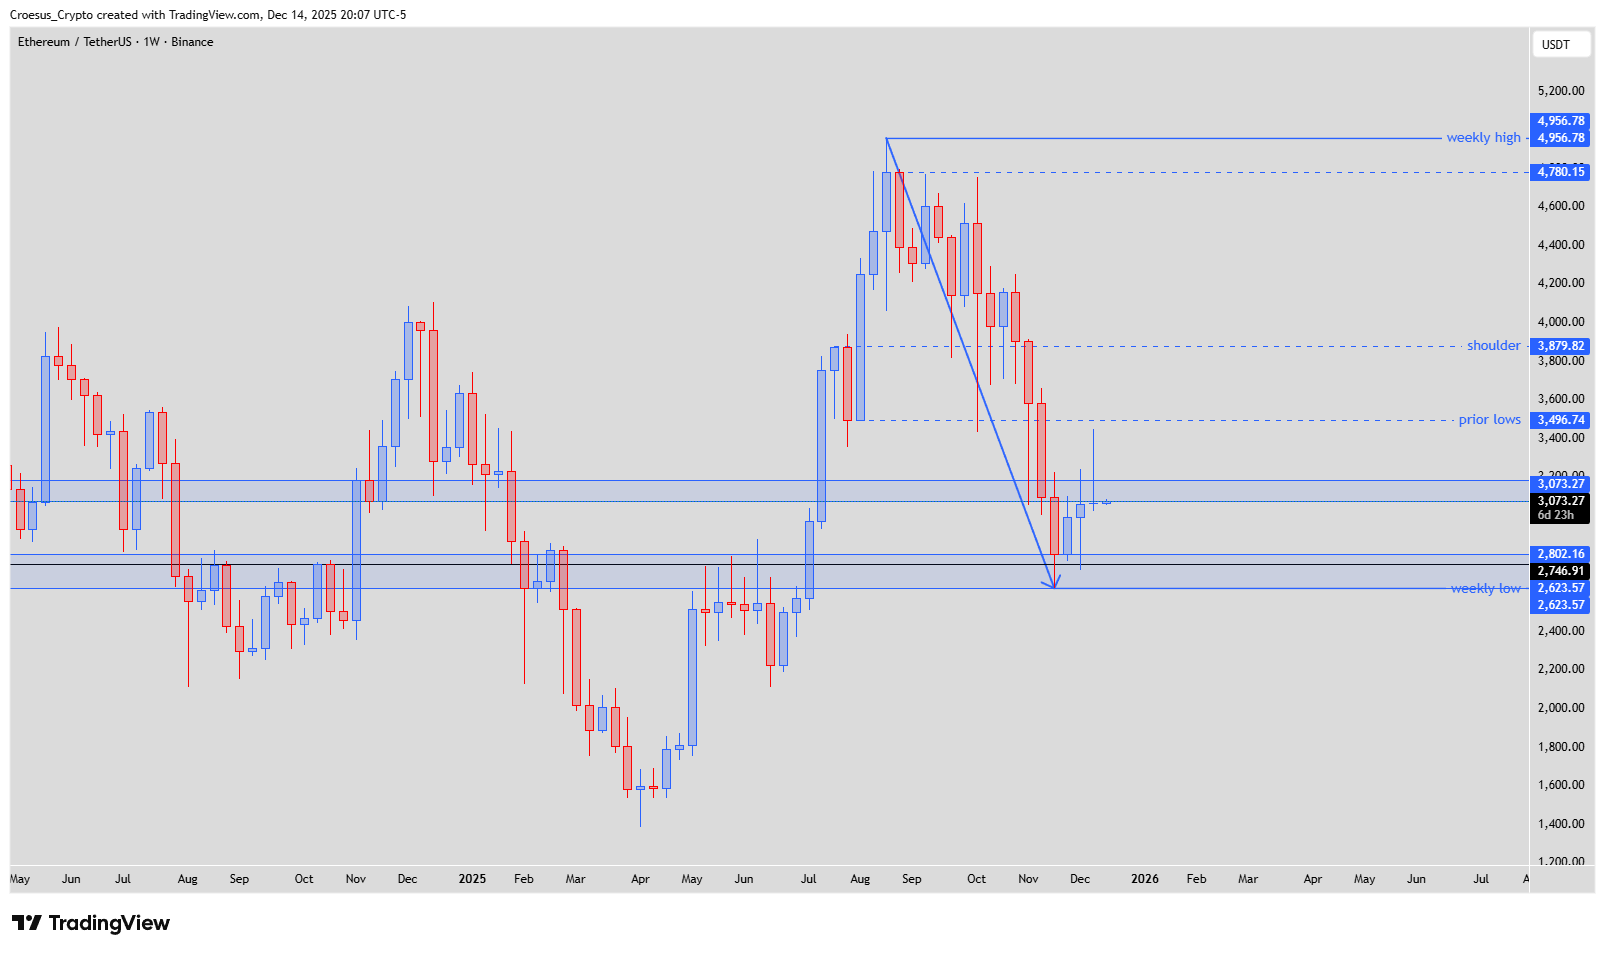
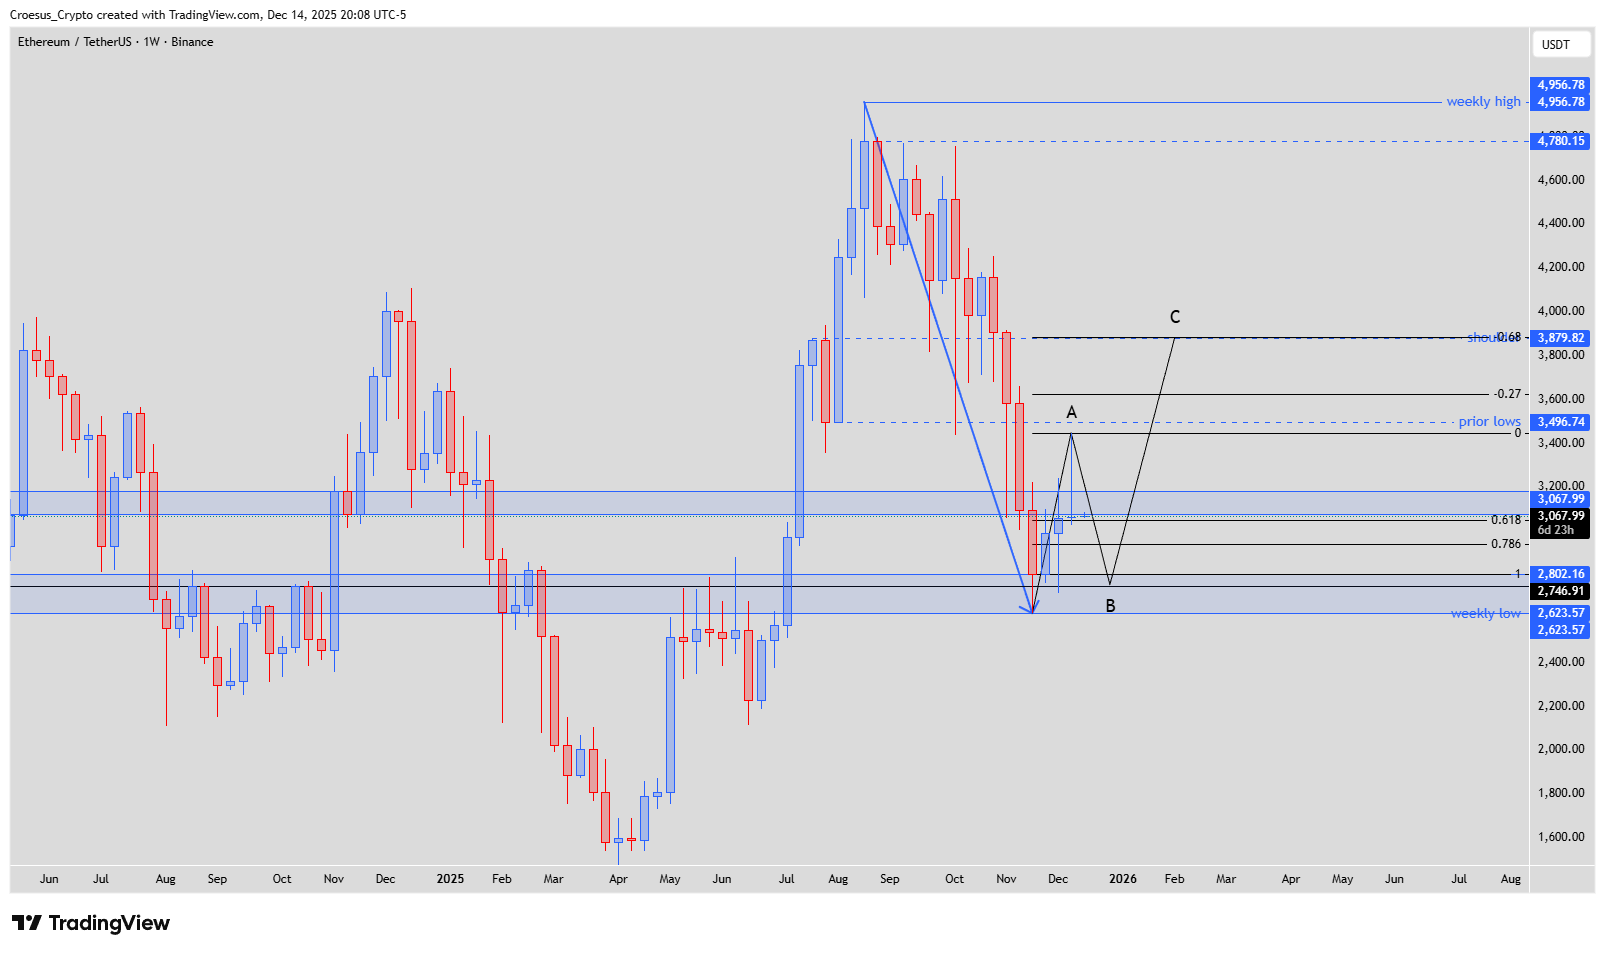
ETH weekly chart 2025 highlighting strong bounce from 2.62k–2.80k demand zone and current consolidation below prior lows and shoulder resistance.
Technical Analysis Key Points
- This week we saw a clear rejection of the supply zone, closing the weekly candle with a swing failure.
- This indicates that price might look for more liquidity in the lower demand zone.
- Retesting the demand zone would fit perfectly into the ABC correction of the impulsive bearish sell-off, with this week’s swing high as the A leg. Retesting the demand zone would give us the B leg.
- The target would be the shoulder zone, where we would print the C leg, perfectly confluent with the -0.68.
Market Structure Analysis
This ETH weekly analysis shows a strong impulsive move down from the 4.7k–4.9k region, followed by a corrective bounce into the current supply zone near prior lows. The swing-failure pattern at that supply confirms it as key support resistance.
An ABC corrective structure fits well here: A at the current rejection, B projected into the 2.62k–2.80k demand zone around the weekly low, and C aiming for the shoulder area near 3.88k, aligning with the -0.68 Fibonacci level drawn from the bearish impulse. This keeps the broader trend bearish while allowing for a sizeable corrective rally.
Key Levels and Scenarios
Demand zone 2.62k–2.80k (weekly low): likely B-leg liquidity area.
Prior lows ~3.50k: mid-range resistance inside the correction.
Shoulder / -0.68 Fib ~3.88k: projected C-leg target and strong supply.
Weekly high zone 4.78k–4.95k: invalidation area for the bearish corrective view.
Trading Implications
If ETH respects demand and then rallies toward the shoulder zone, the ABC correction would be considered complete and a bearish continuation from 3.8k–3.9k becomes the primary scenario.
This analysis is not financial advice; always do your own research and manage your risk before trading.