

In this Ethereum weekly analysis for week 51 of 2025, we observe how ETH remains in a consolidating range after the sharp November sell-off. The corrective move higher was capped by the prior IC level at $3,706, while last week’s strong swing failure led to another retest of the $2,802 weekly low. Buyers quickly absorbed that dip, defending the level for now. However, as price sits between strong resistance and support, the structure remains neutral — both bullish recovery and bearish continuation paths are still viable within this zone.
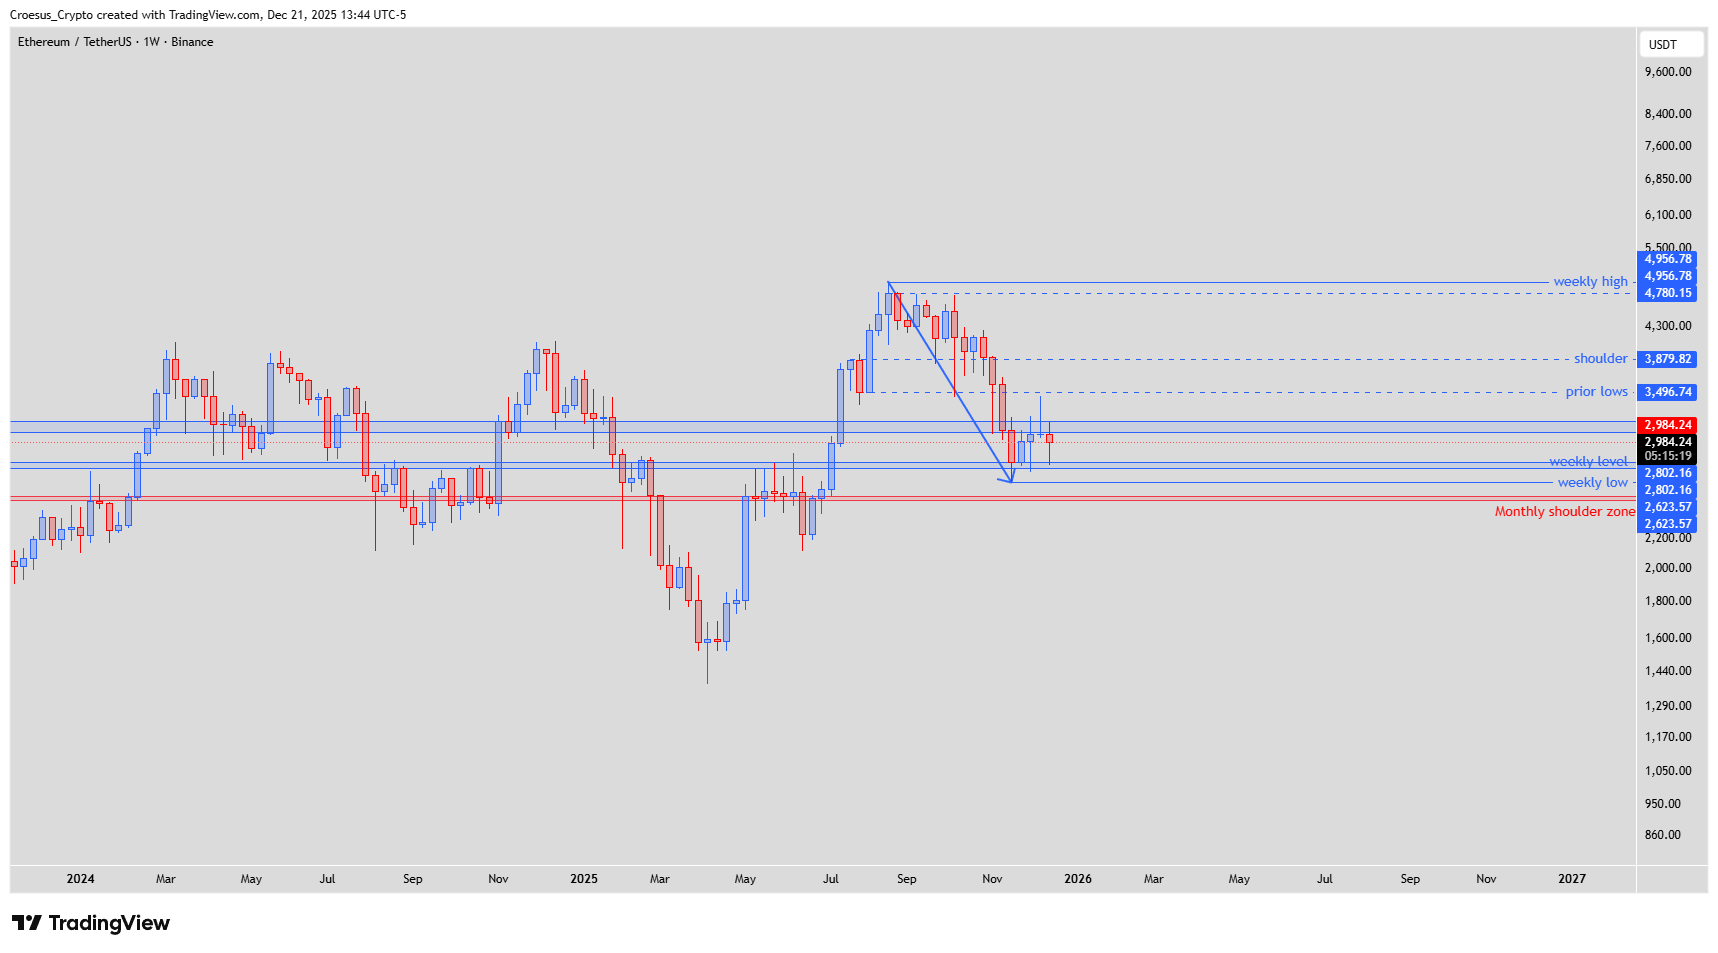
Ethereum weekly chart week 51 2025 with prior IC level resistance at $3,706, weekly low support at $2,802, and range-bound structure between key zones.
Technical Analysis Key Points
- After the sharp and impulsive sell-off in November 2025 we saw the price making a slight recovery that was capped by a prior IC level @ $3,706.00
- After the strong swing failure of last week, price retested the low of the range @$2,802.16, but was quite quickly bought back up again.
- This set-up could go both ways:
- Bullish: If ETH can maintain support at $2,802 and reclaim $3,496–$3,706, the current pattern may evolve into a corrective ABC move targeting $3,879 (shoulder level) or even $4,780 (weekly high). That would confirm demand re-entering from the lower boundary of the range.
- Bearish: Failure to hold above $2,802 would suggest the recent recovery was merely corrective. A breakdown could expose deeper liquidity toward the $2,623–$2,620 monthly shoulder zone, or even the $2,400 region if momentum accelerates.
Market Structure Analysis
The ETH weekly structure shows clear compression between $3,706 resistance and $2,802 support. November’s sell-off marked the start of a bearish leg, but the subsequent rebound and recent defended low hint that sellers are losing momentum at current prices.
The $3,706 prior IC level has acted as a ceiling for several weeks, highlighting that buyers must reclaim that level to shift momentum.
Key Levels and Scenarios
Key levels to watch:
$3,706 – prior IC resistance, key for bullish confirmation
$3,496 – prior lows, local resistance mid-range
$2,984 – current pivot / midrange level
$2,802 – weekly low and short-term support
$2,623 – monthly shoulder zone and final downside structure
Bullish scenario: reclaim of $3,706 leading to an ABC correction targeting $3,879–$4,780.
Bearish scenario: failure at $2,802 leads to a continuation toward the $2,620 zone.
Trading Implications
ETH sits within a well-defined range. Directional confirmation requires a weekly close beyond $3,706 or below $2,802. Until then, the risk/reward favors reactive trading at range extremes with disciplined stops and smaller sizing.
This analysis is not financial advice; always do your own research and manage your risk before trading.