

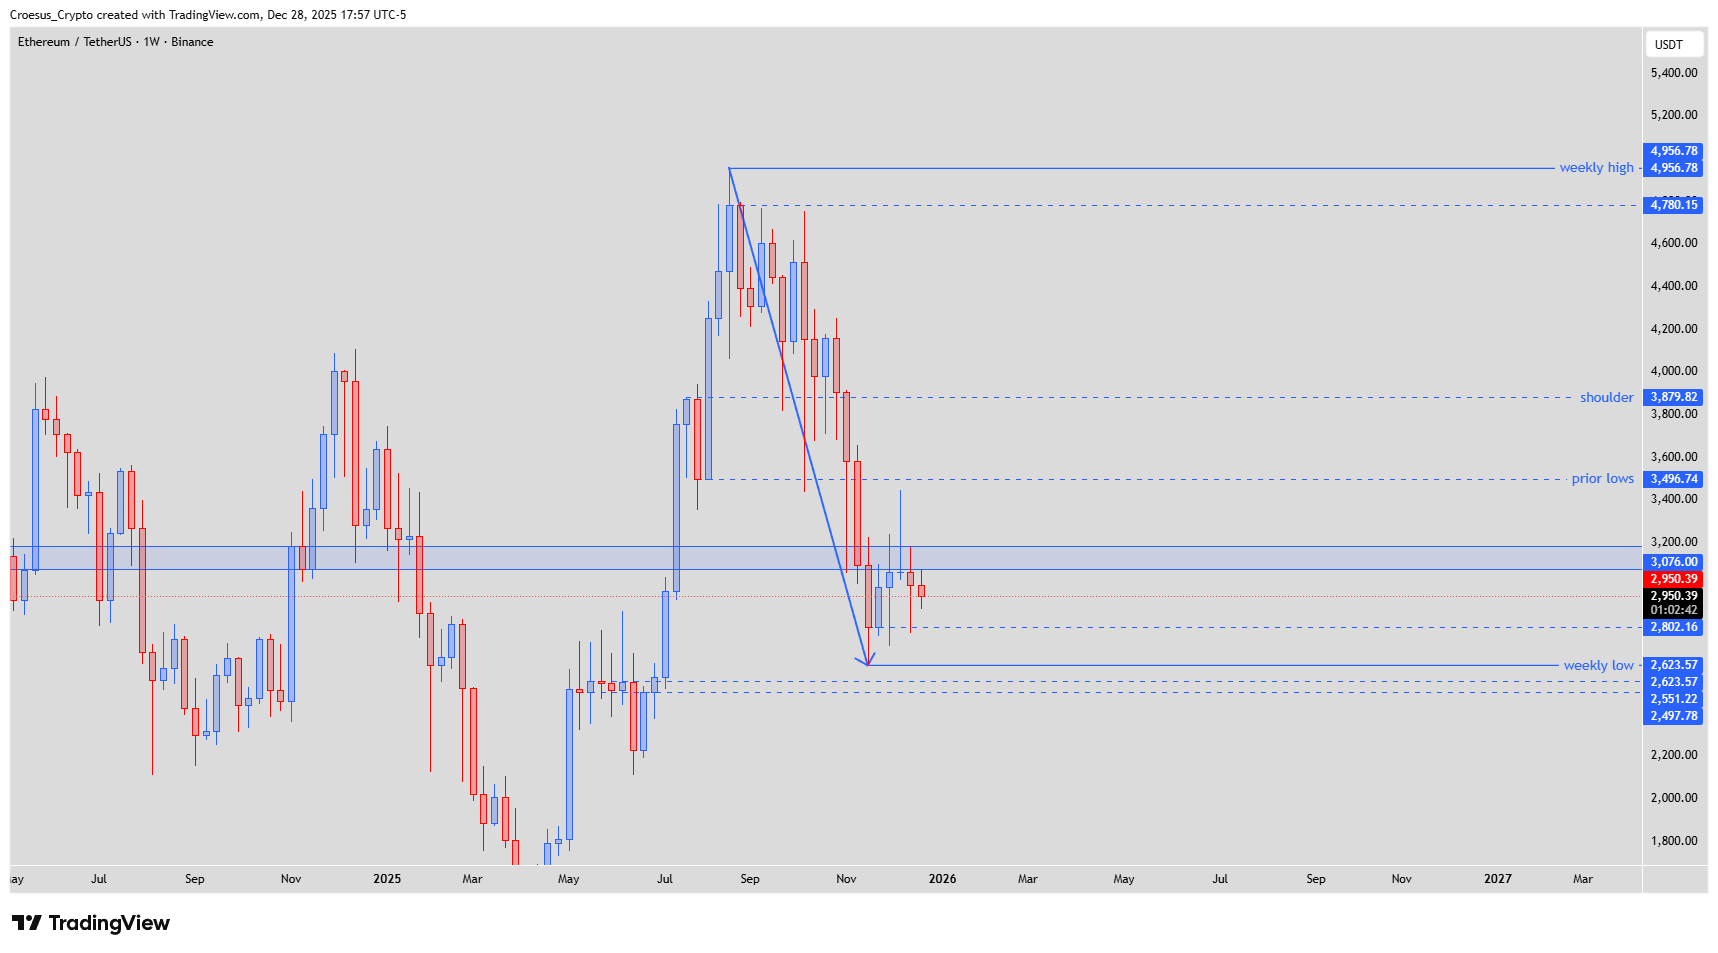
Our Ethereum weekly analysis for week 52 December 2025 focuses on the strong bearish impulse down, followed by a capped retest into an institutional candle zone and early signs of a corrective structure. This technical analysis highlights a potential ABC correction, but within a still-dominant bearish trend.
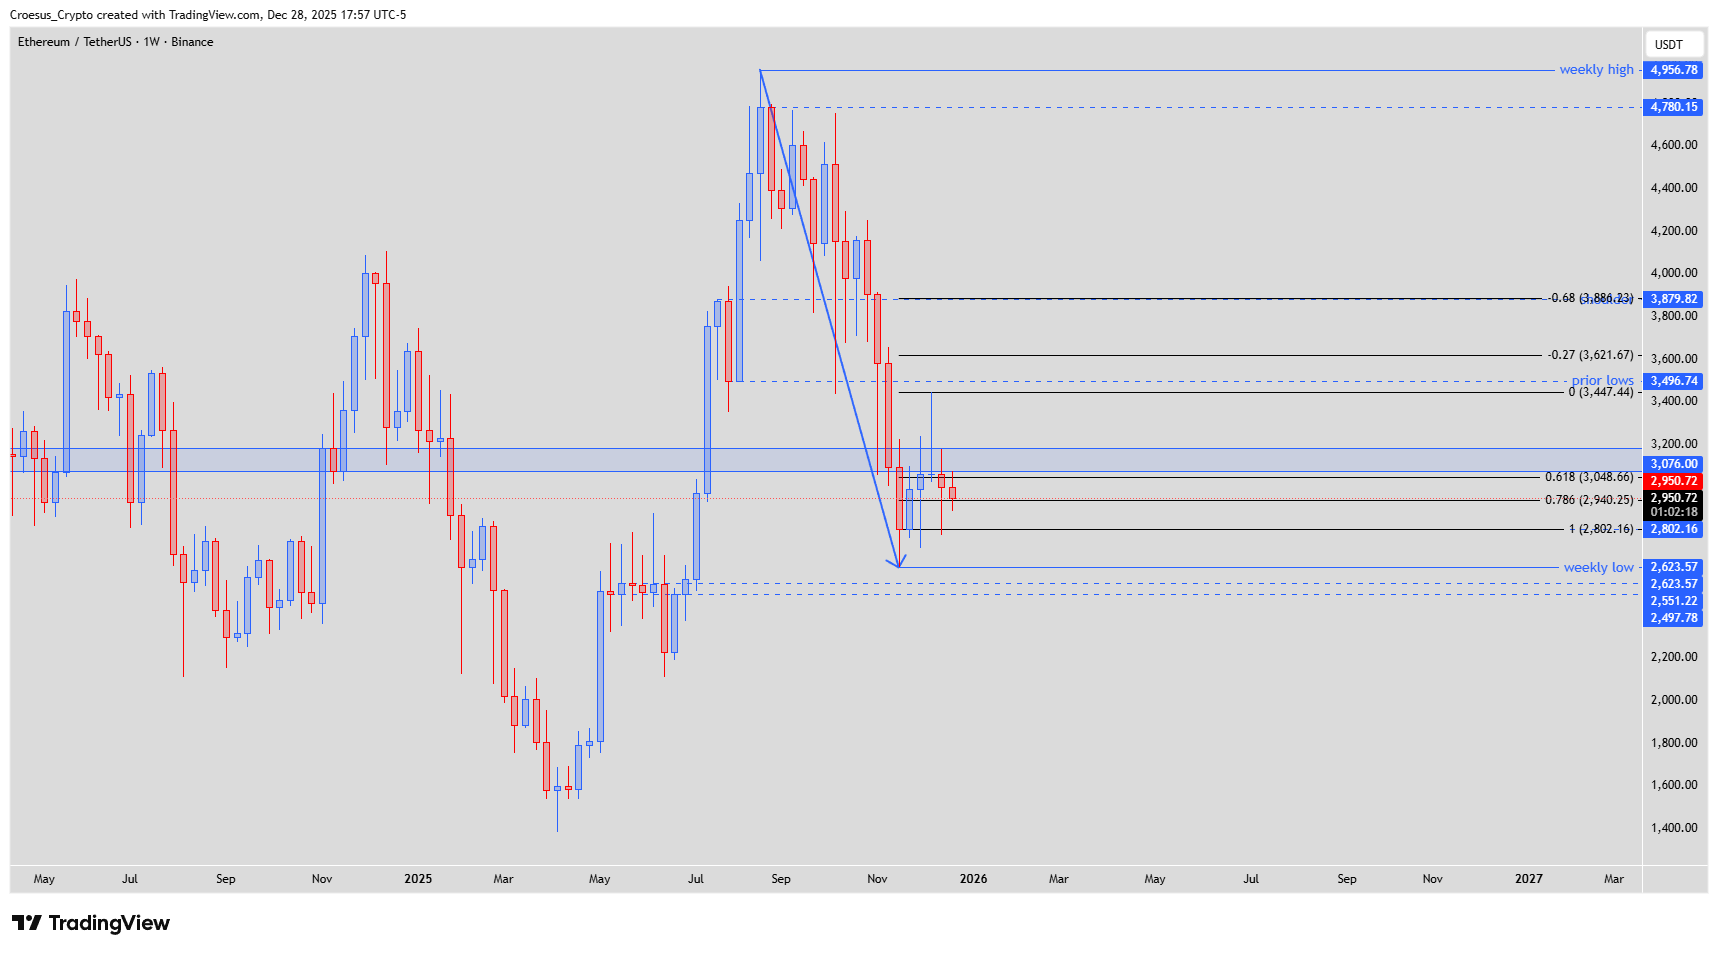
Ethereum weekly chart December 2025 with head and shoulders structure, weekly low and key support resistance levels for ABC correction.
Technical Analysis Key Points
- After the impulsive sell-off, we saw the price making a retest, but the price was capped against a level created by an institutional candle.
- After the swing failure created beginning of December we saw some rejections retesting the low of the bearish move.
- This could be the start of an ABC correction of the bearish impulse. If we take the the fib retracement from the swing failure high until the candle close of the bearish impulse low, we can see the -0.68 level perfectly confluent with the shoulder level of the larger head and shoulder pattern @ $3.879
- REMARK : eventhough that the corrective move until the shoulderlevel @ $3.879 level might be bullish, we still have to take into account that this move is still a coorective move of a bearish impulse and should be treated as such.
- REMARK 2 : whilst we could start the ABC correction from this level, we could still see a structural retest of the entire lower wick of the bearish impulse. As long as we don't see a close below the weekly low, there is no break of structure. Even a wick until the $2.500 zone is possible, possibly retesting the right shoulder of that inverse head & shoulder. Watch for bullish reversal patterns on the lower time frames (daily / 4H)
Market Structure Analysis
On the weekly chart, ETH sells off impulsively, then retests higher into an institutional candle where price is rejected, confirming that area as strong resistance and shifting focus back to support resistance dynamics. The subsequent swing failure at the start of December and repeated rejections near the lows suggest absorption rather than immediate continuation, opening the door for an ABC corrective sequence.
Using Fibonacci retracement from the swing failure high to the close of the bearish impulse low, the -0.68 extension aligns closely with the $3,879 shoulder of the larger head and shoulders pattern, making this level a prime candidate for a corrective target if the ABC develops.
However, as long as weekly closes hold above the weekly low and potentially defend the $2,500 zone, the broader structure remains a corrective phase inside a larger downtrend rather than a confirmed reversal.
Key Levels and Scenarios
Bullish (corrective) scenario:
If buyers defend the weekly low and form bullish reversal patterns on daily or 4H charts, an ABC corrective rally toward the $3,879 shoulder – and possibly the prior-lows region just below – becomes likely, still framed as a counter-trend move within our Ethereum weekly analysis.
Key levels to watch:
Weekly low: Critical structure level; weekly close below confirms fresh downside continuation.
$2,500 zone: Potential wick-retest and demand area, overlapping the right shoulder of the inverse head and shoulders.
Institutional candle level (~current resistance): First cap on price; acceptance above would strengthen the corrective case.
$3,879 shoulder level (-0.68 Fib): Main Fibonacci and pattern confluence; probable cap for the ABC correction.
Trading Implications
Traders should treat any upside toward the institutional candle and $3,879 shoulder as a counter-trend opportunity with reduced position sizing, tight invalidation below the weekly low or $2,500 wick zone, and close monitoring of lower-timeframe technical analysis signals.
This analysis is not financial advice; always do your own research and manage your risk before trading.