

ETH Marketcap / Ethereum
Our ETH weekly analysis Week 7 for February 2026 focuses on how the recent bearish impulse is transitioning from a momentum-driven move into a more classical structural retest of prior support resistance. This technical analysis is based on clean price action and Fibonacci confluence, without relying on indicators.
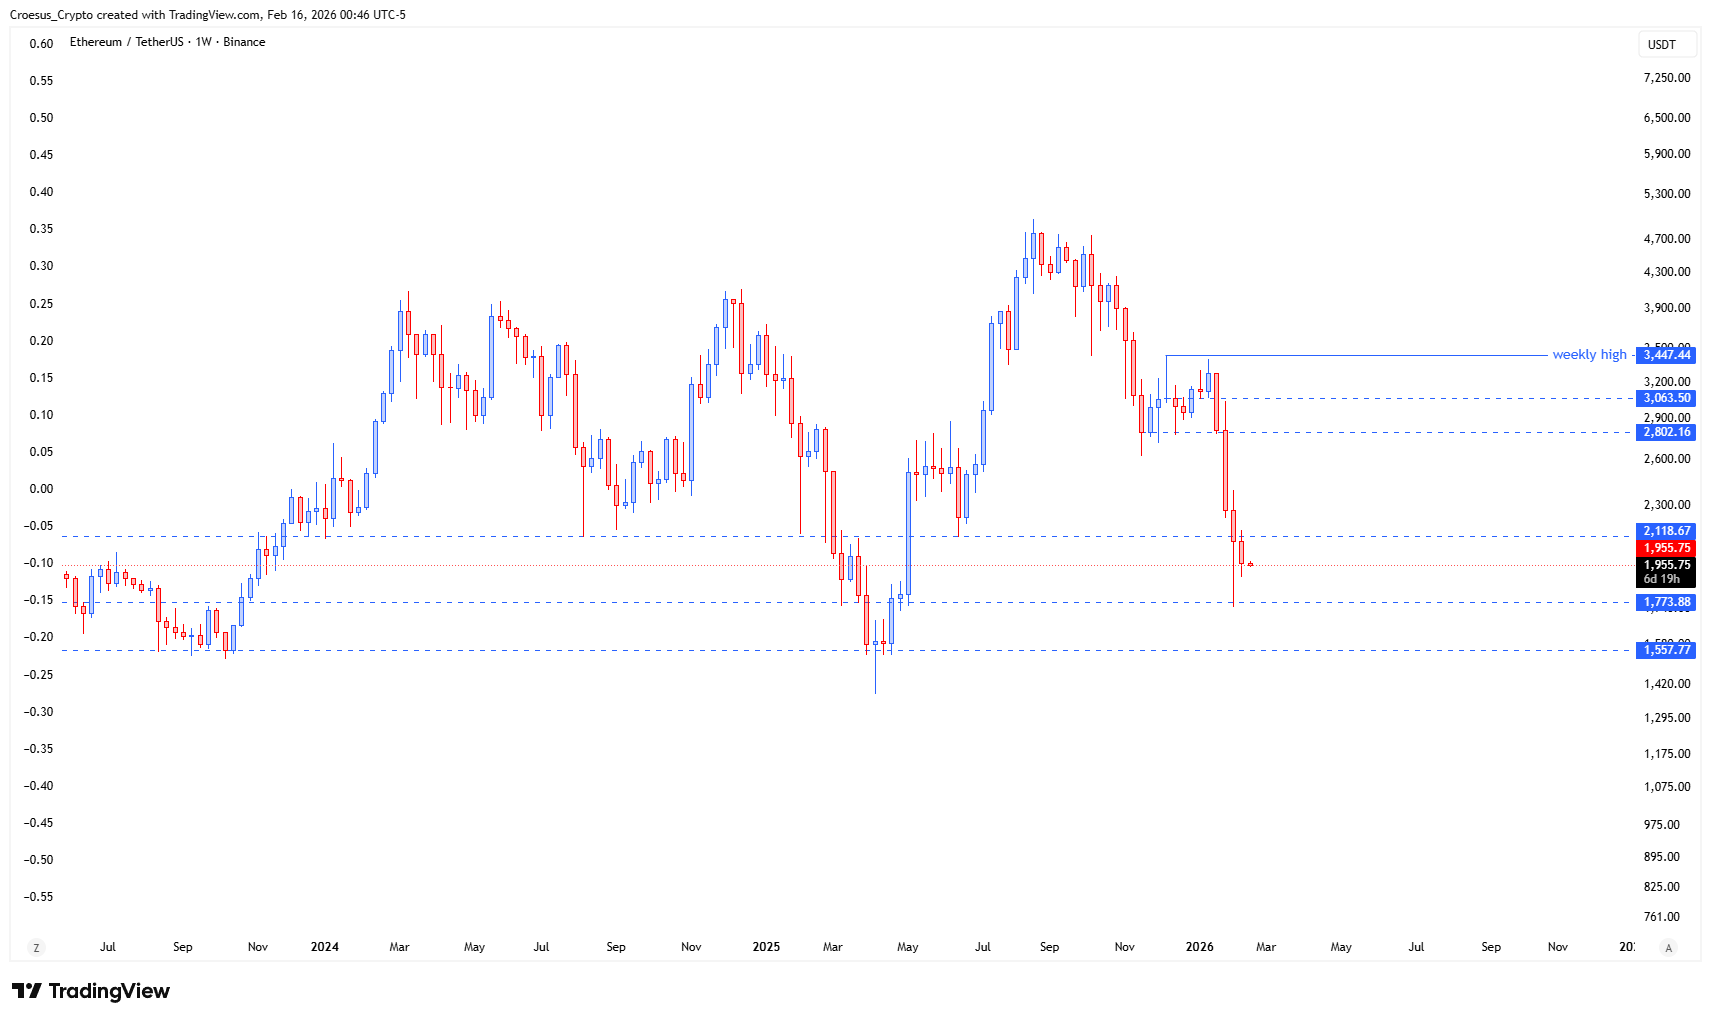
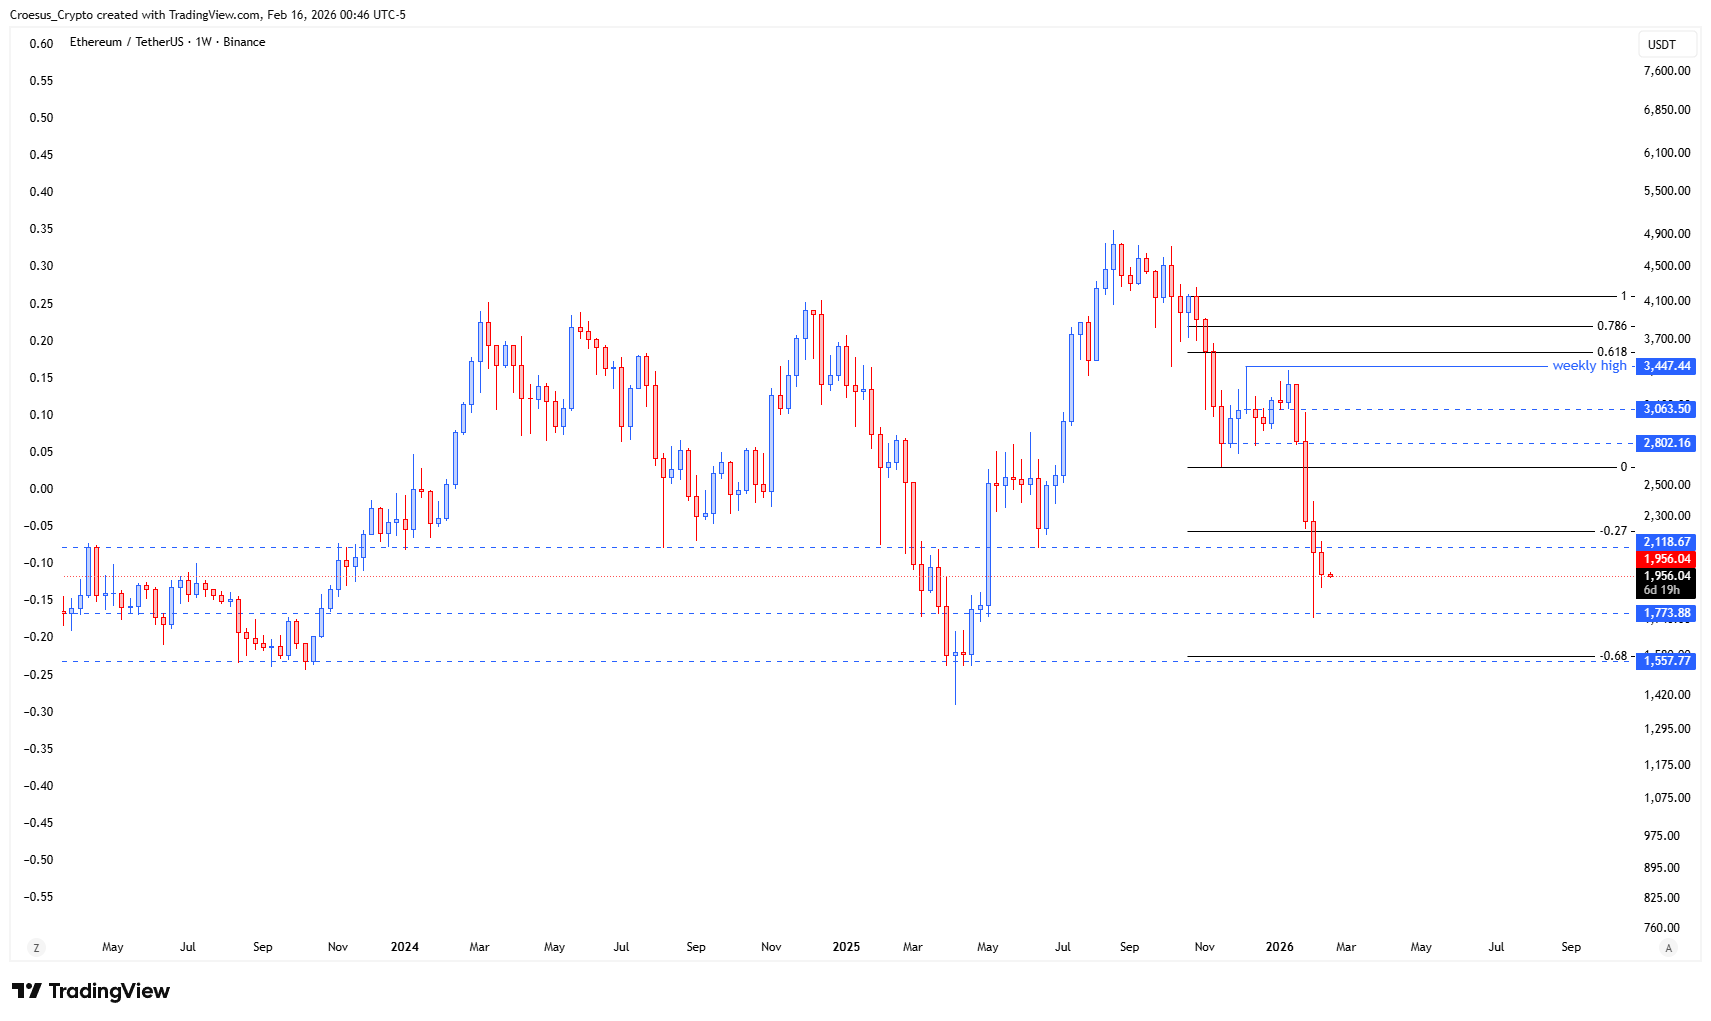
- ETH showed us a momentum retest of a previous weekly level, but last week the price started a structural retest.
- We don't see any signs of a reversal yet besides the fact that last week the candle did not close below the previous low.
- If we look at the fib extension level -0.68, we can see that it aligns with the low of the bullish impulse at approx. $1500
Market Structure Analysis
From a market structure perspective, ETH first broke down from a key weekly level and then snapped back in a momentum retest, rejecting higher prices and confirming that zone as resistance. Last week’s candle began the structural retest lower: bodies are now migrating down, but sellers failed to close below the prior weekly low, signaling early loss of bearish strength even though a reversal is not yet visible.
The main focus of this ETH weekly analysis is the confluence between the Fibonacci extension at -0.68 and the low of the previous bullish impulse around $1,500. This area forms a high-probability reaction zone where we expect significant two-way order flow, as it combines measured-move symmetry with a major historical demand area in terms of support resistance.
Key Levels and Scenarios
Bullish scenario: If price continues this structural retest into the $1,500 Fibonacci -0.68 zone and buyers step in with strong weekly closes back above the recent low, ETH could stage a mean-reversion move toward the reclaimed weekly level and, in extension, toward the previous weekly high region near $3,400.
- Previous weekly level: now strong resistance; first upside confirmation if reclaimed on a weekly close.
- Last week’s low: local line in the sand for short-term momentum.
- $1,500 zone (Fib -0.68): primary downside support and potential demand cluster.
- Prior weekly high near $3,400: major upside target if a full corrective bounce unfolds.
This analysis is for informational purposes only and does not constitute financial advice.