

ETH Marketcap / Ethereum
In this Ethereum weekly analysis for week 8 February 2026, we see price following the same playbook as BTC and TOTAL: an aggressive impulse down, a strong wick reaction from the lows, and now a slower structural grind that retests that wick. Our technical analysis focuses on how this behavior frames the ongoing range between the 3,284 USDT weekly high and the 1,747 USDT weekly low, with the daily ABC correction still shaping short-term swings.
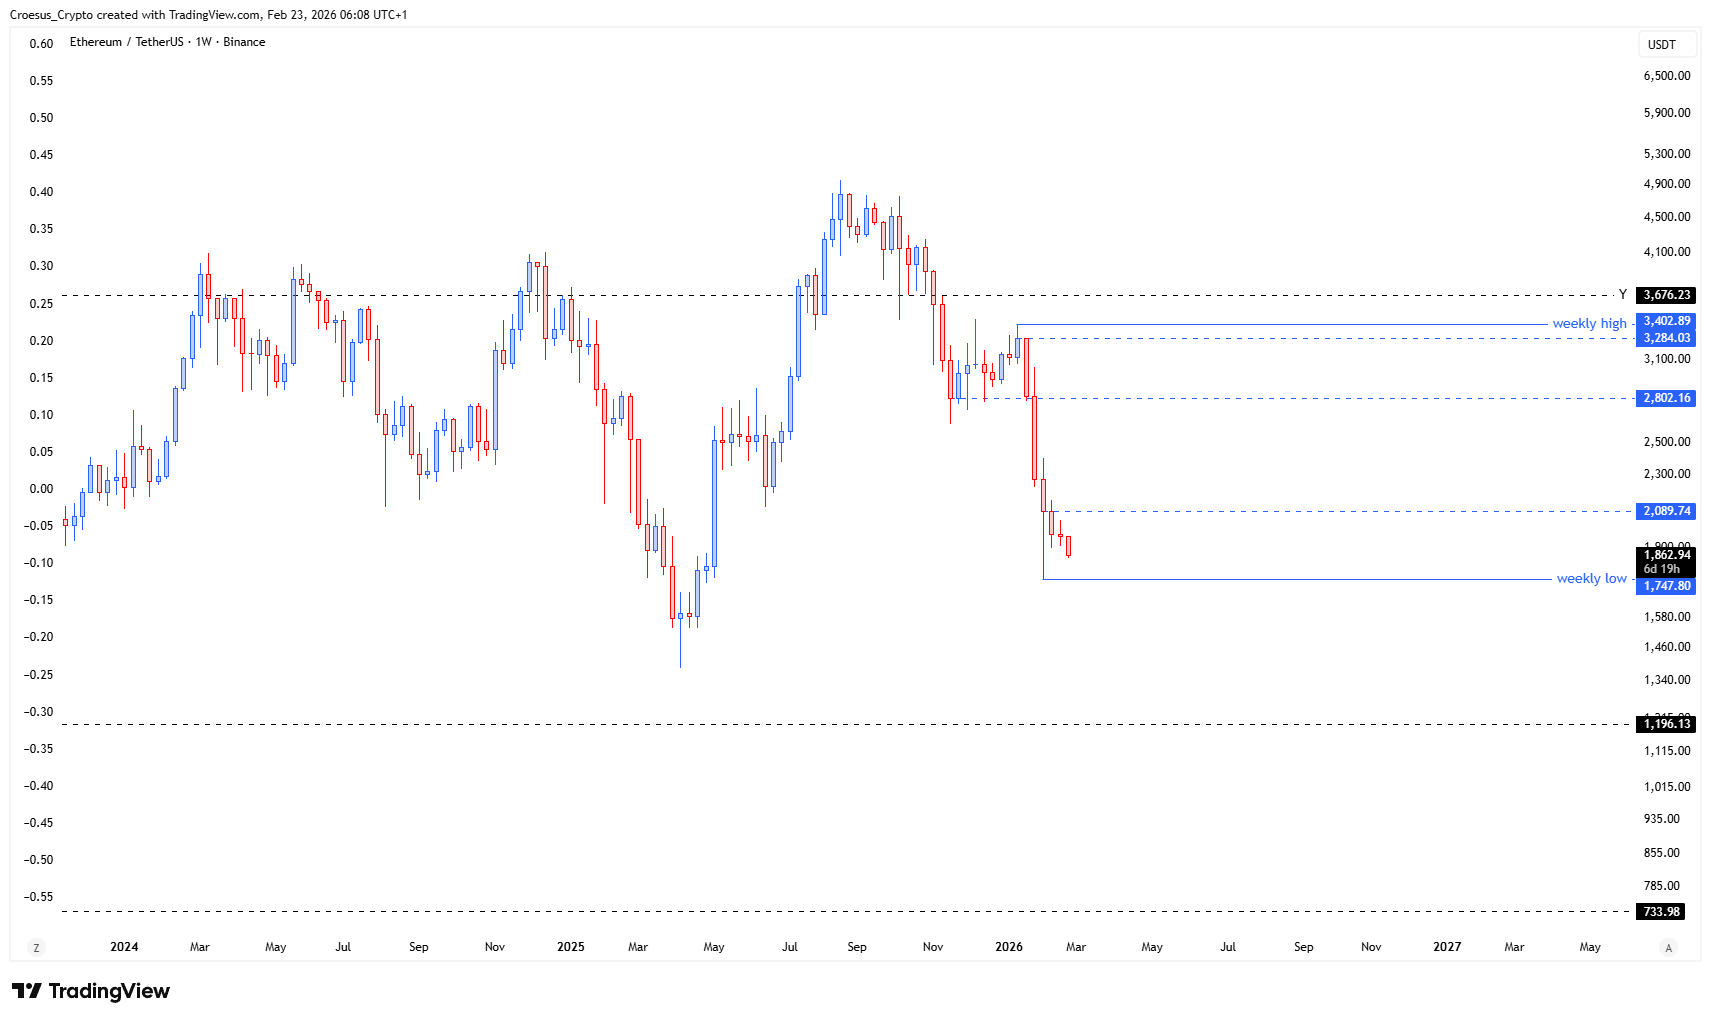
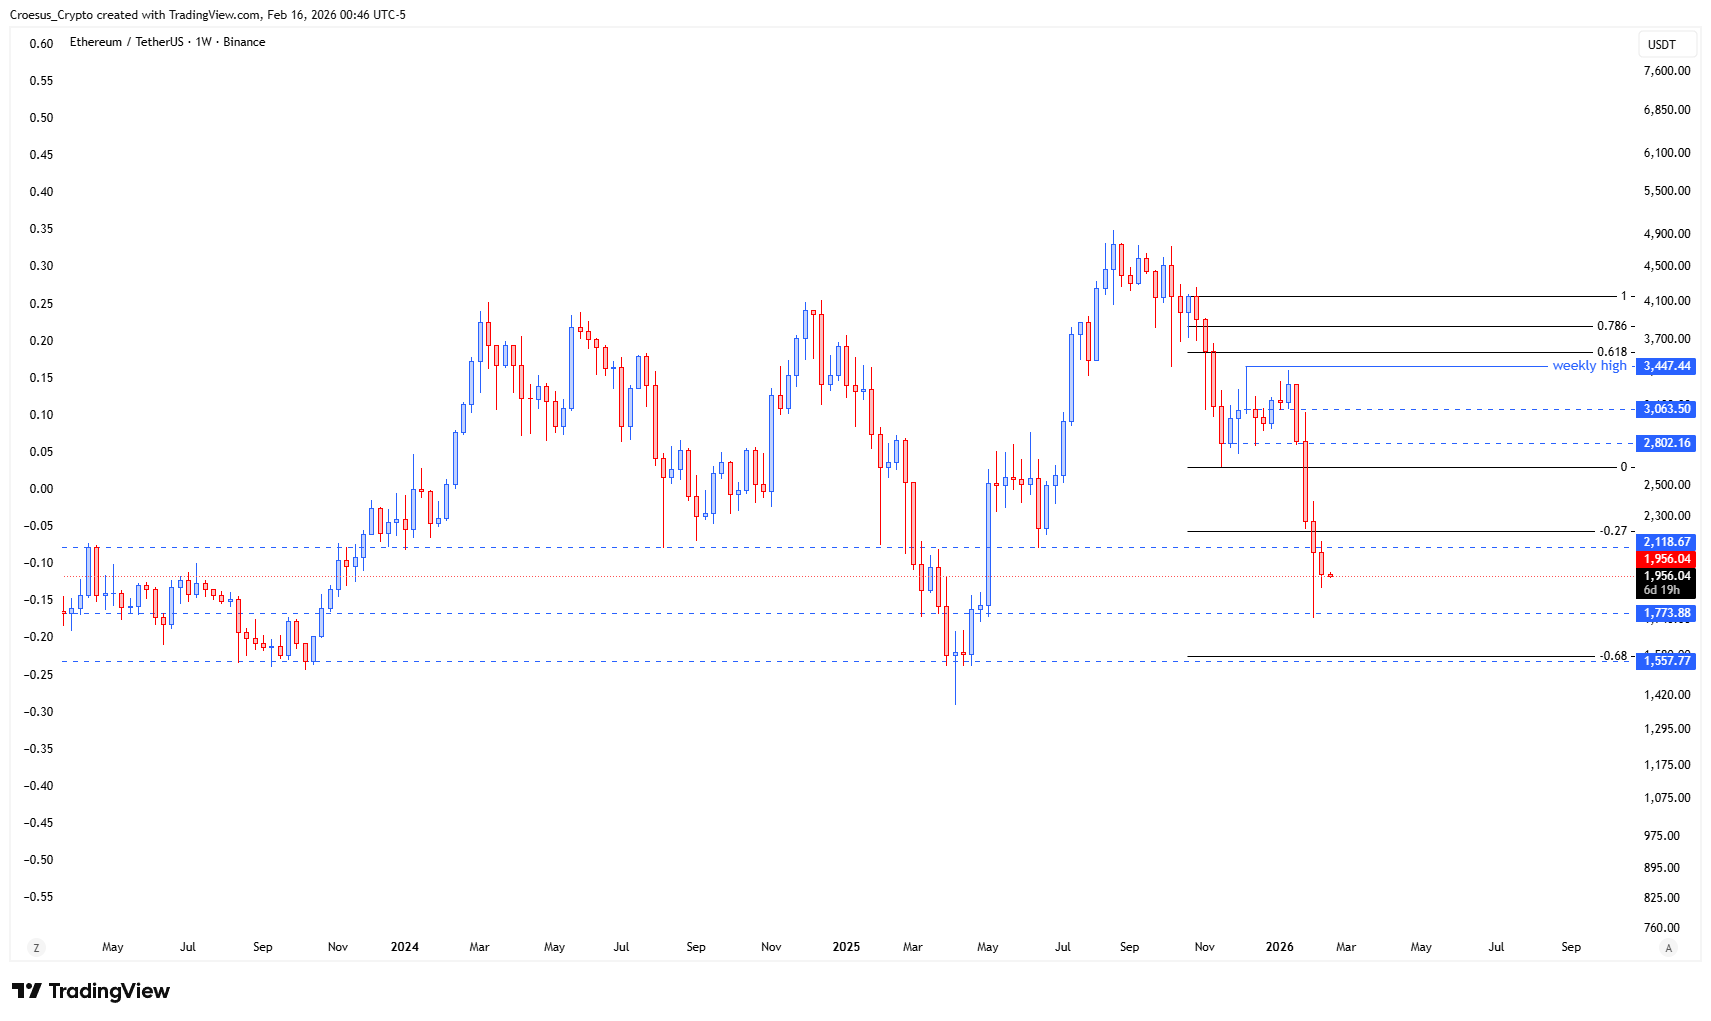
- Same scenario : a momentum retest followed by a continued structural retest.
- On the daily chart : ABC correction remains in play
Market Structure Analysis
On the weekly chart, ETH sold off sharply from the 3,284 area and wicked into the 1,747–1,800 zone before bouncing. Since then, candles show overlapping price action, confirming that the initial momentum retest has transitioned into a structural retest of that wick rather than a fresh impulse. The main support resistance bands sit around 2,089 (prior weekly level) and 2,802 (former range support now resistance).
On the daily timeframe, the ABC correction remains in play, with the “B” and “C” legs oscillating inside the 1,86k–2,16k region. The visible Fibonacci retracements around 2,089 (0.786) and just below 2,000 (0.618) further reinforce this as a key decision zone for the next directional move.
Key Levels and Scenarios
Bullish scenario: if buyers continue to defend the 1,747 weekly low and reclaim 2,089 on a closing basis, the ABC structure can resolve higher toward 2,270–2,396 first, and later into 2,802 and potentially a larger retrace toward the 3,284 weekly high.
- $3,284 – weekly high, major resistance and top of current structure.
- $2,802 – former support turned resistance; important reclaim for medium-term bulls.
- $2,089–2,105 – key mid-range / Fibonacci retracement zone and local pivot.
- $1,941–1,864 – intra-range support cluster within the ABC correction.
- $1,747 – weekly low and critical structural support; breakdown would invalidate the bullish corrective thesis.
This analysis is for informational purposes only and does not constitute financial advice.