

ETH Marketcap / Ethereum
ETH weekly analysis Week 9 2026. Ethereum stays structurally bearish, but the weekly chart shows momentum cooling as price compresses and consolidates inside a highlighted fake-out zone after a prolonged impulsive leg.
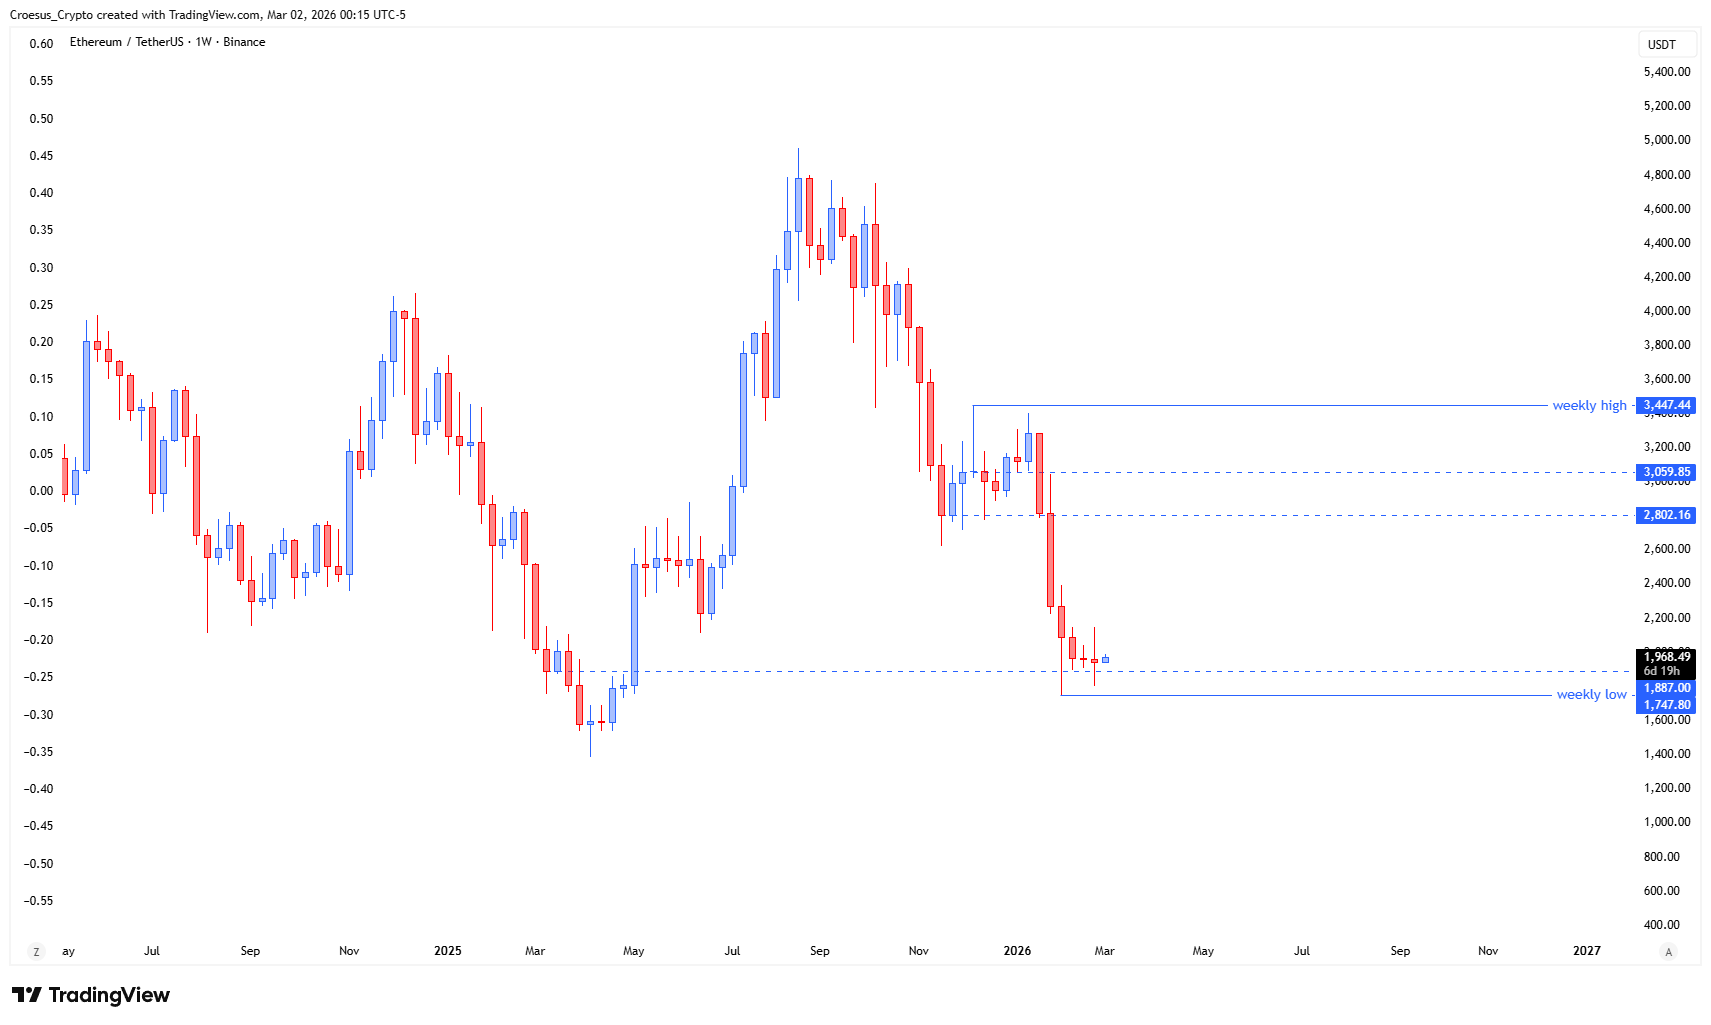
- Same scenario : price slowing down and consolidating in the fake-out zone
- Candles are smaller and overlapping showing us that bulls are trying to convince the bears to turn sides
Market Structure Analysis
In this ETH weekly analysis, PHASE 4 (prolonged impulse) keeps the broader structure biased to the downside: sellers have already produced an extended move, and the market is now shifting from expansion into consolidation.
The key read from the chart is the overlap—weekly candles getting smaller and printing into each other typically signals reduced directional conviction and a more balanced order flow.
Structurally, this behaviour often develops around major horizontal support resistance zones where trapped liquidity from a “fake-out” gets worked through before the next continuation or deeper correction unfolds.
While bulls “trying to convince the bears to turn sides” can precede a corrective rebound, the weekly structure still needs a clear change in swing behaviour (acceptance above the consolidation area and follow-through) to argue that the bearish impulse is losing control rather than simply pausing.
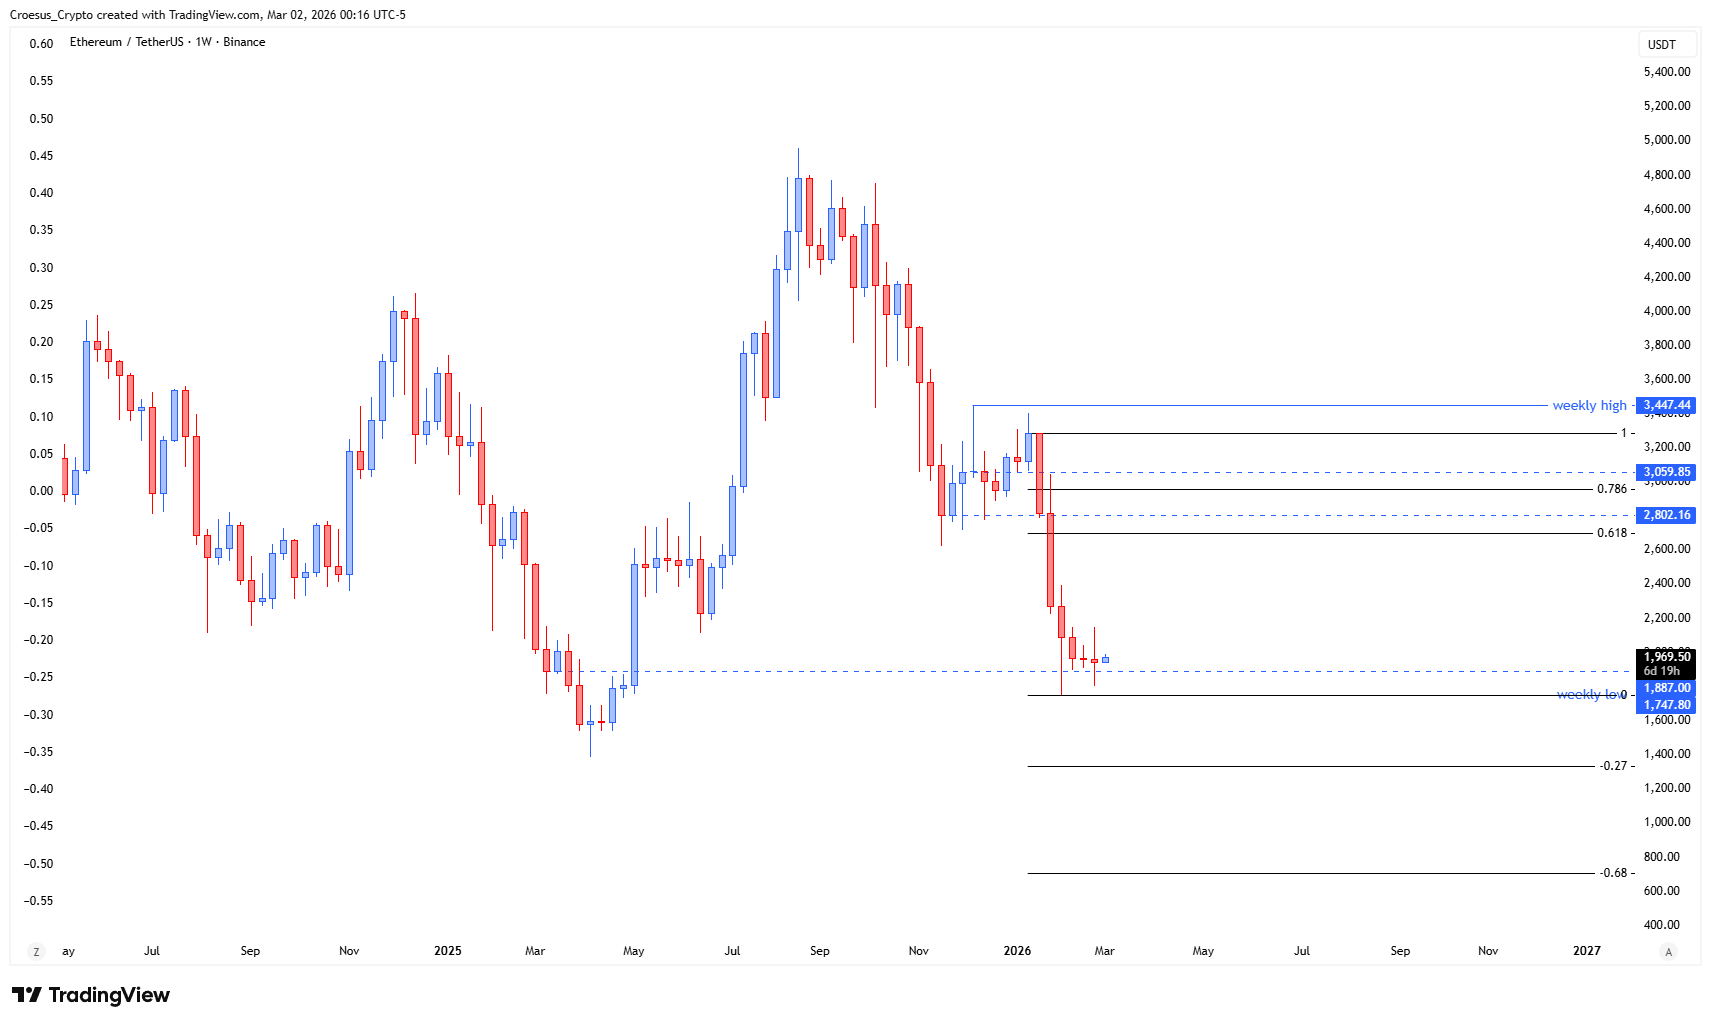
Key Levels and Scenarios
With trend still bearish, the base case remains continuation unless price proves otherwise. A bearish continuation scenario triggers if ETH rejects from the upper boundary of this consolidation and breaks down from the range low, confirming the pause as a corrective structure within the impulse. A bullish corrective scenario develops if ETH reclaims the consolidation ceiling and holds it as support, signalling acceptance above the fake-out zone and forcing shorts to reassess.
- Consolidation range high (weekly resistance; acceptance above shifts short-term control)
- Consolidation range low (weekly support; breakdown favours bearish continuation)
- Fake-out zone (key liquidity area; watch for rejection vs acceptance)
This analysis is for informational purposes only and does not constitute financial advice.