


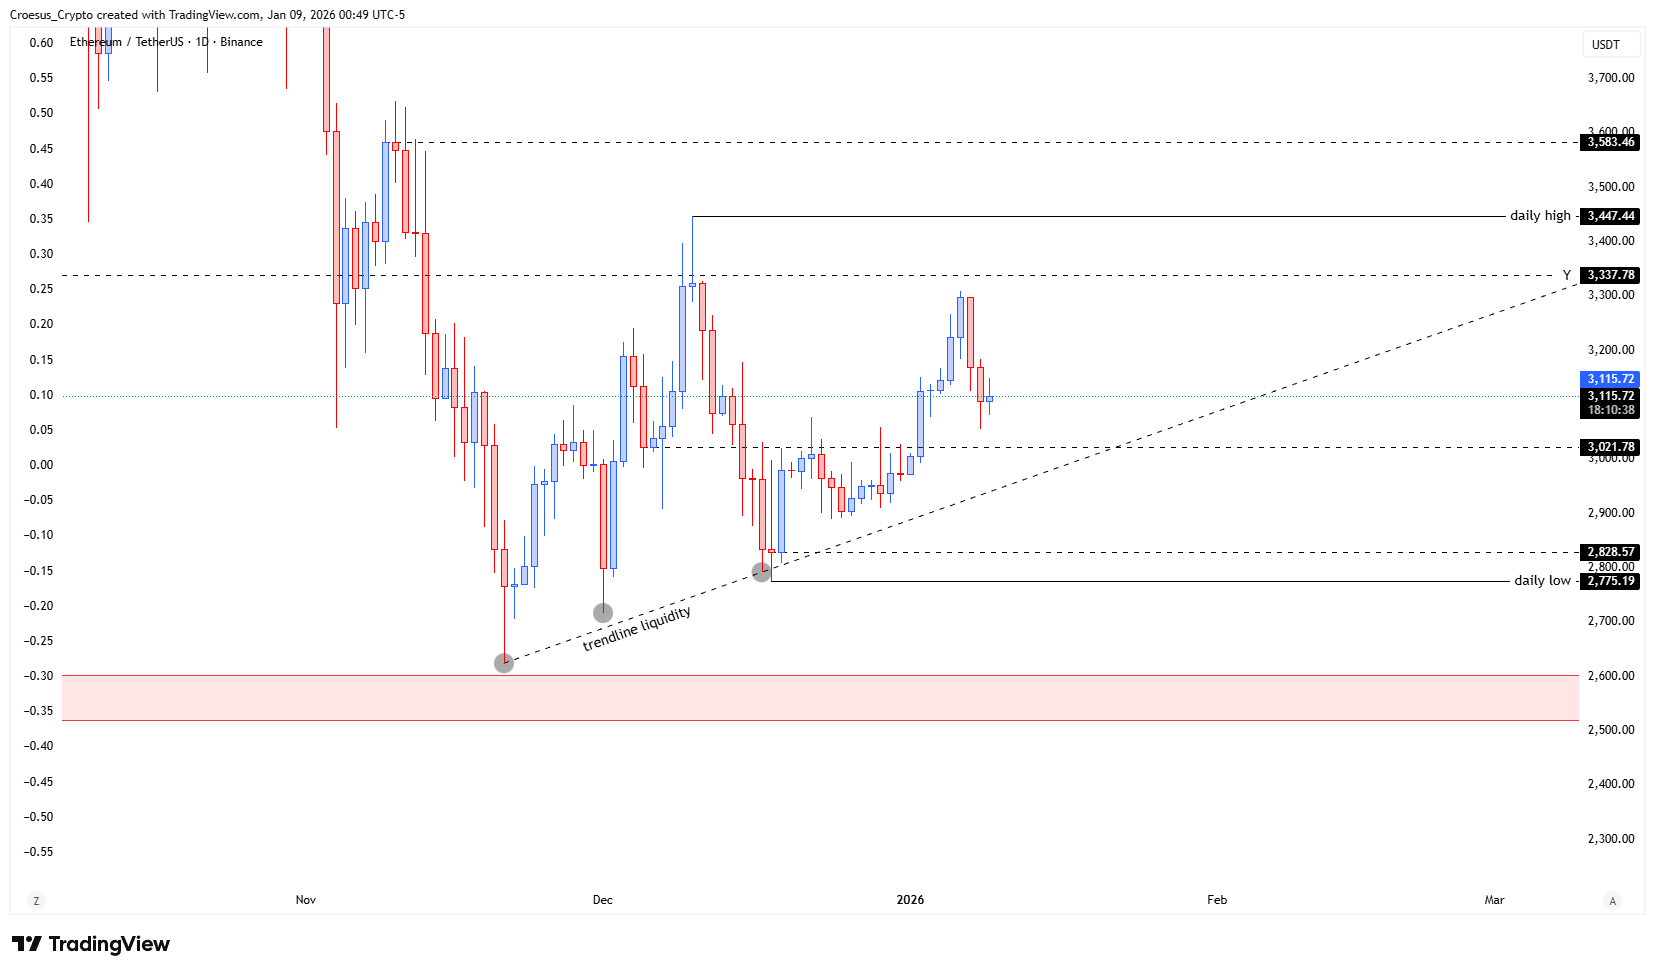
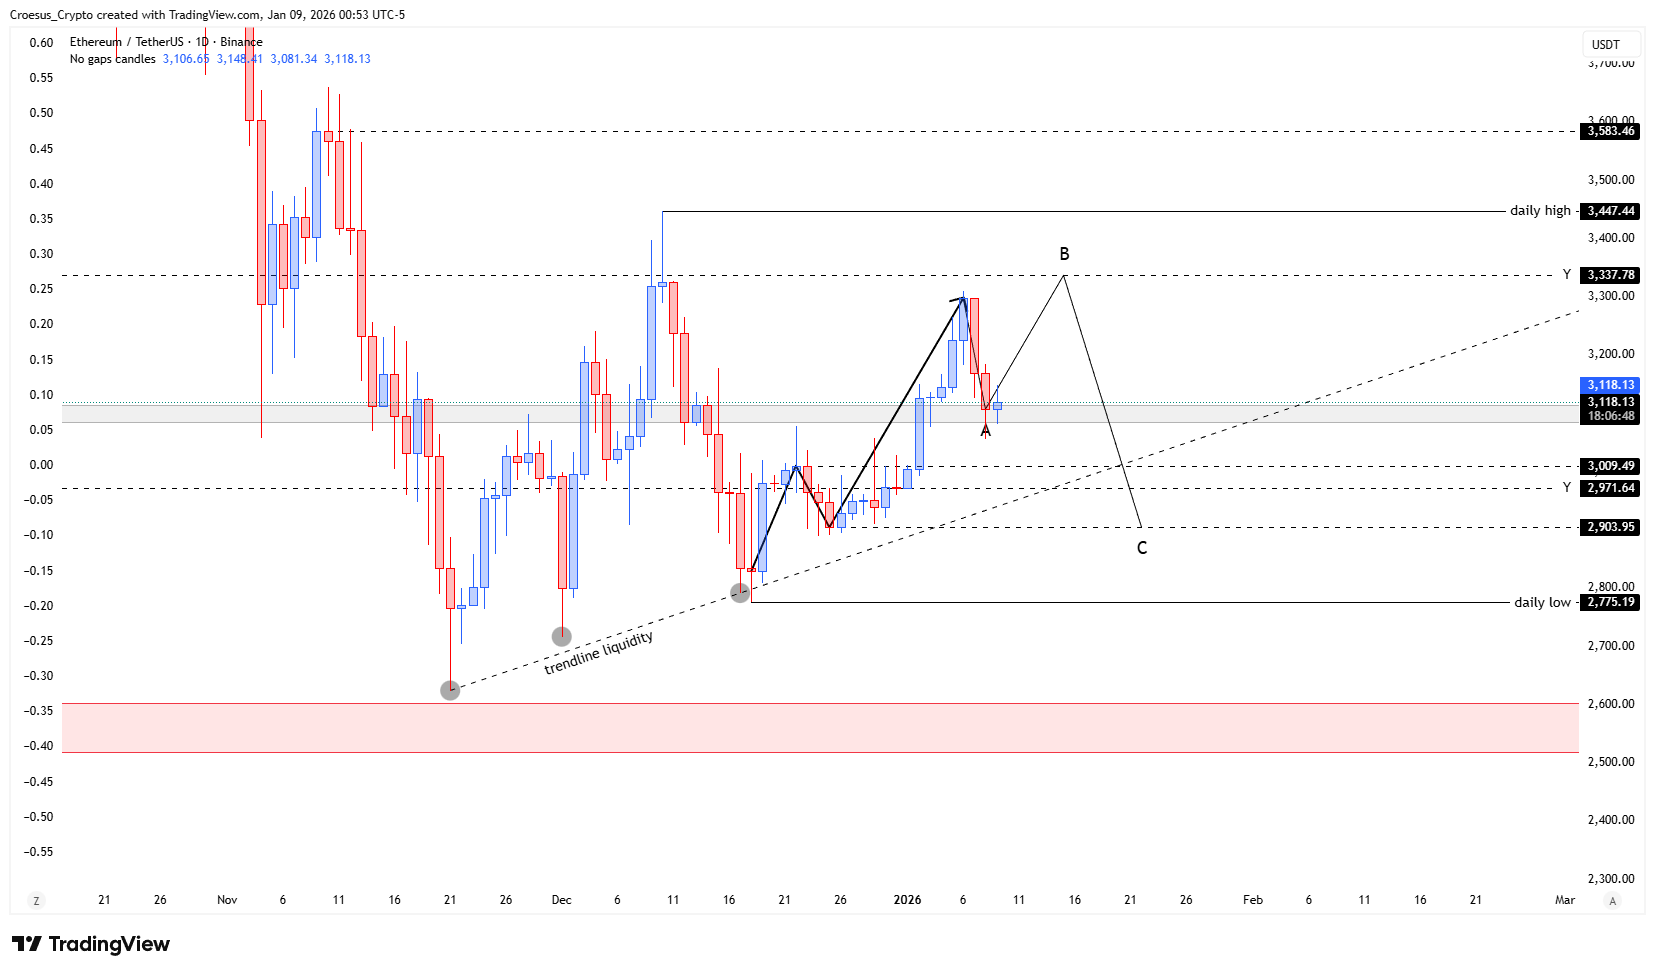
In this Ethereum daily analysis for 08 January 2026, we see price in a corrective phase after the strong bullish impulse from week 1 of 2026. Wednesday’s sell-off pushed ETH back into a demand zone created by a prior institutional candle, where buyers are now attempting to step in. Our technical analysis framework still treats this move as part of a developing ABC correction within a broader bullish context.
Ethereum daily chart 9 January 2026 with projected ABC correction, institutional candle level, and $2,904–$3,009 target zone.
Technical Analysis Key Points
- On Wednesday the price correcting the bullish impulse of week 1 of 2026.
- The price touched a level created by a prior instutional candle. We could expect some shortterm bullish relief from here, retesting the highs or even, with a wick, touching the yearly high.
- But even with this shortterm bullish, we would like to see price completing the ABC structure completely.
- Main target zone at this moment for a bullish set-up remains the zone between $2.903,95 (fib 100%) and $3.009,49 (first structure). In that zone is also the yearly open level 2026.
- We need remain aware that we still have a monthly level @ $2.600 that remains untouched, and below the current price a lot of trend line liquidity has been build up.
Market Structure Analysis
Our Ethereum daily analysis views the current pullback as the A-leg of an ABC corrective structure. The reaction from the institutional candle zone suggests short-term bullish relief is possible, potentially retesting the local highs around $3,337 and, with a wick, even tagging the yearly high near $3,447. This would form the B-leg before a deeper C-leg completes the structure.
The key confluence for support resistance lies between $2,903.95 (Fibonacci 100% retracement) and $3,009.49 (first structure). The 2026 yearly open level sits inside this band, reinforcing it as our preferred demand zone for a new bullish setup if price reaches it. Below, an untouched monthly level around $2,600 and multiple higher lows along the trendline highlight significant liquidity that could still attract price later in the cycle.
Key Levels and Scenarios
Bullish scenario: A controlled pullback into the $2,904–$3,009 zone, followed by strong rejection and higher lows on the trendline, would support continuation toward $3,337 then $3,447 and beyond.
Key levels to watch:
$3.447: Daily high / potential B-leg exhaustion zone.
$3.337: Intermediate resistance; confirmation level for renewed strength.
$3.009.49: First structure support; upper bound of main buy zone.
$2.903,95: Fibonacci 100% retracement and lower bound of main zone.
$2.600: Untouched monthly level and deep liquidity magnet if the correction extends.
Trading Implications
For traders, patience around support resistance is key: fading exhaustive wicks into $3,337–$3,447 or hunting bullish confirmation in the $2,904–$3,009 zone offers the cleaner risk/reward, while deeper exposure near $2,600 should be sized conservatively given the liquidity build-up below.
This content is for educational purposes only and is not financial advice or a recommendation to buy or sell any asset.