


In this Ethereum daily analysis for 10 December 2025, we focus on price action around the Fibonacci -1 extension and the potential corrective move back into the $3,031–$3,000 support area. Our technical analysis combines a bullish M pattern with an underlying inverse head-and-shoulders structure to define key support resistance zones.
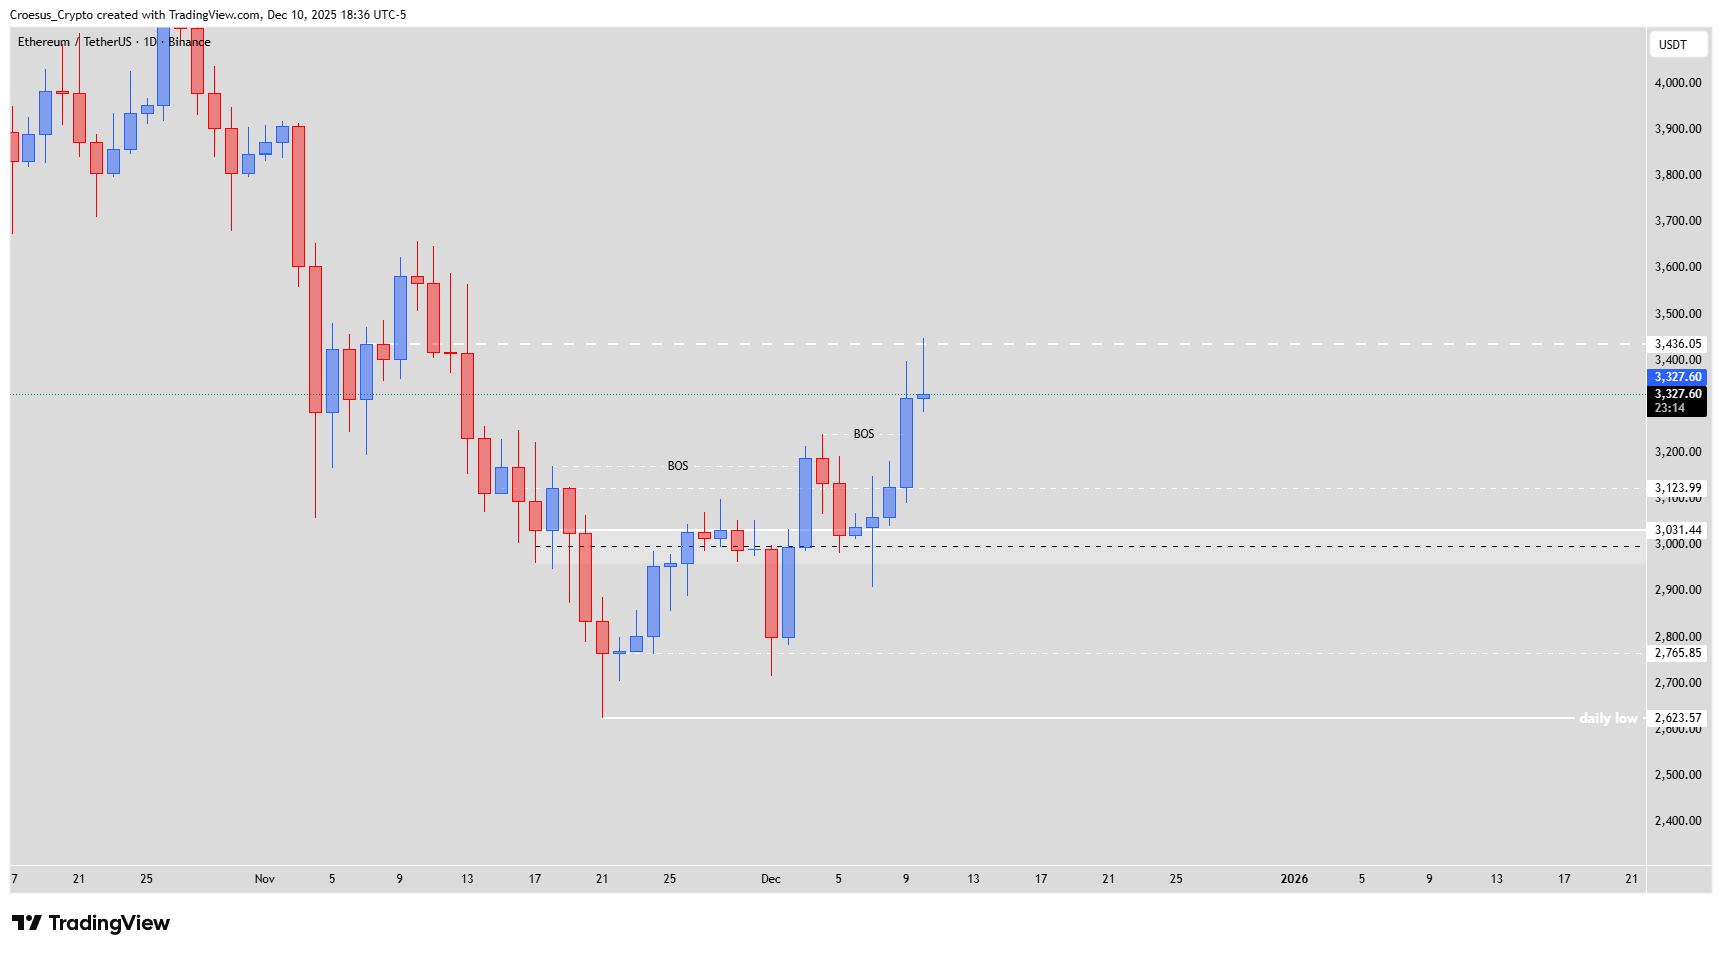
Ethereum daily chart 10 December 2025 highlighting breakout structure and overhead resistance zone
Technical Analysis Key Points
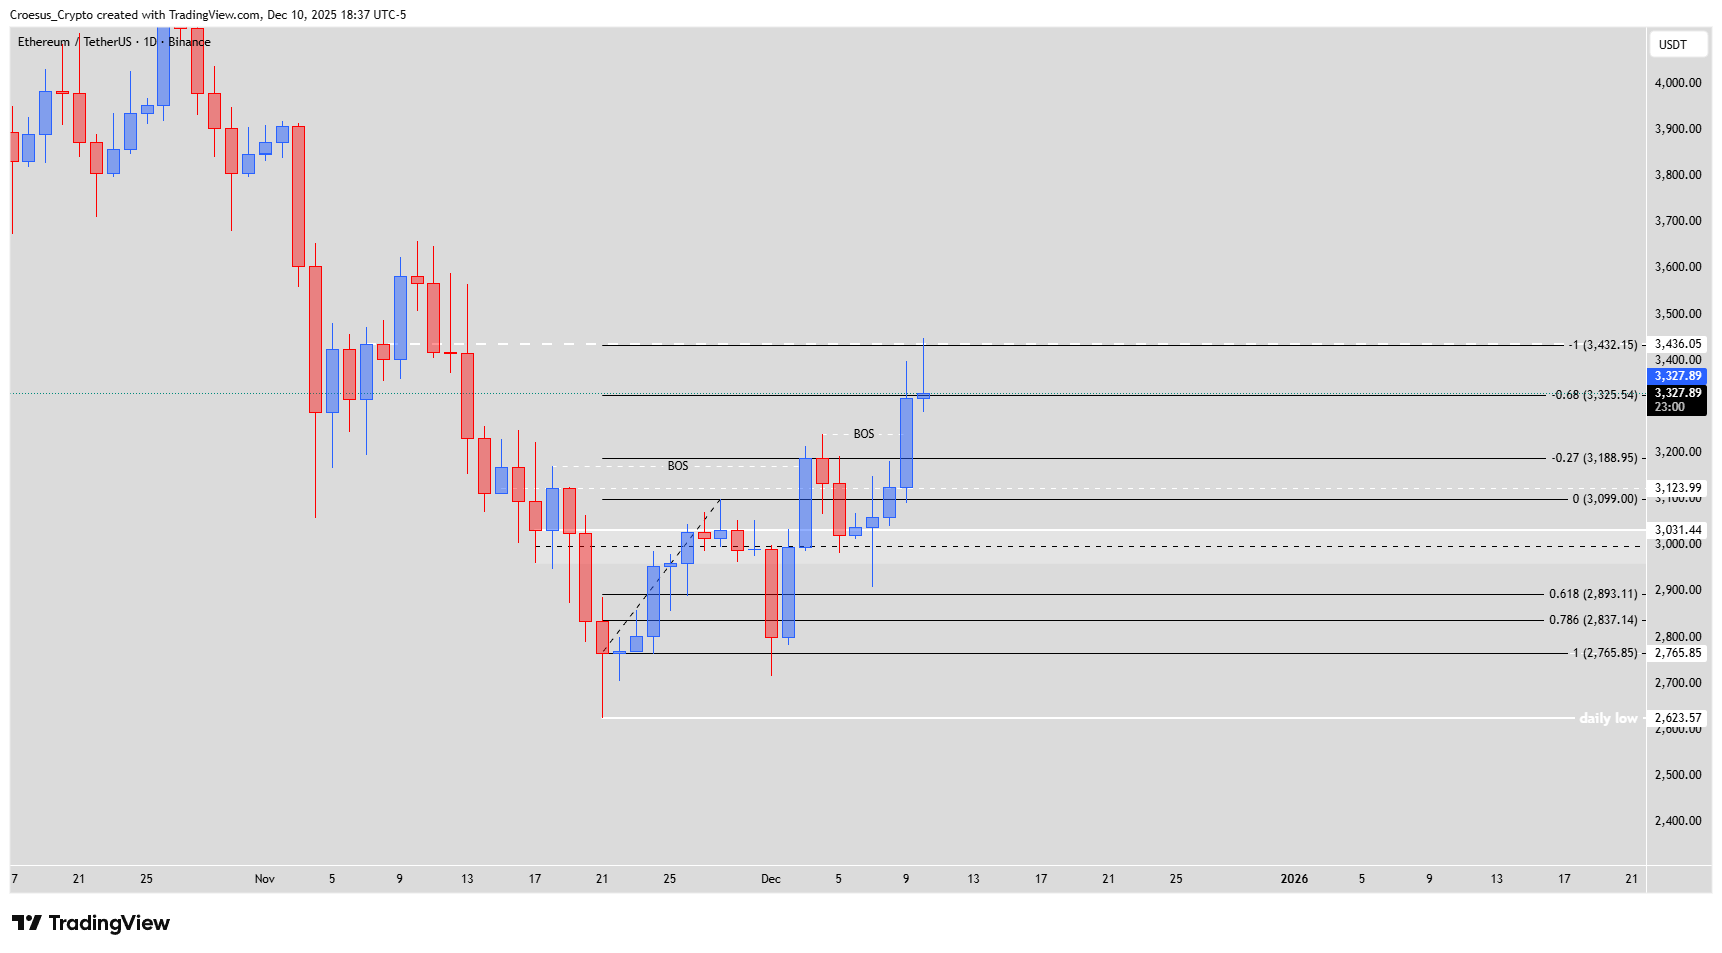
- Today the price pushed further until the fib -1 level, a level we seeing touched more often in the crypto market (more volatility). But the day ended with a swing failure candle, a small body but a long upper wick.
- This action keeps the analysis valid that we might expect a correction.
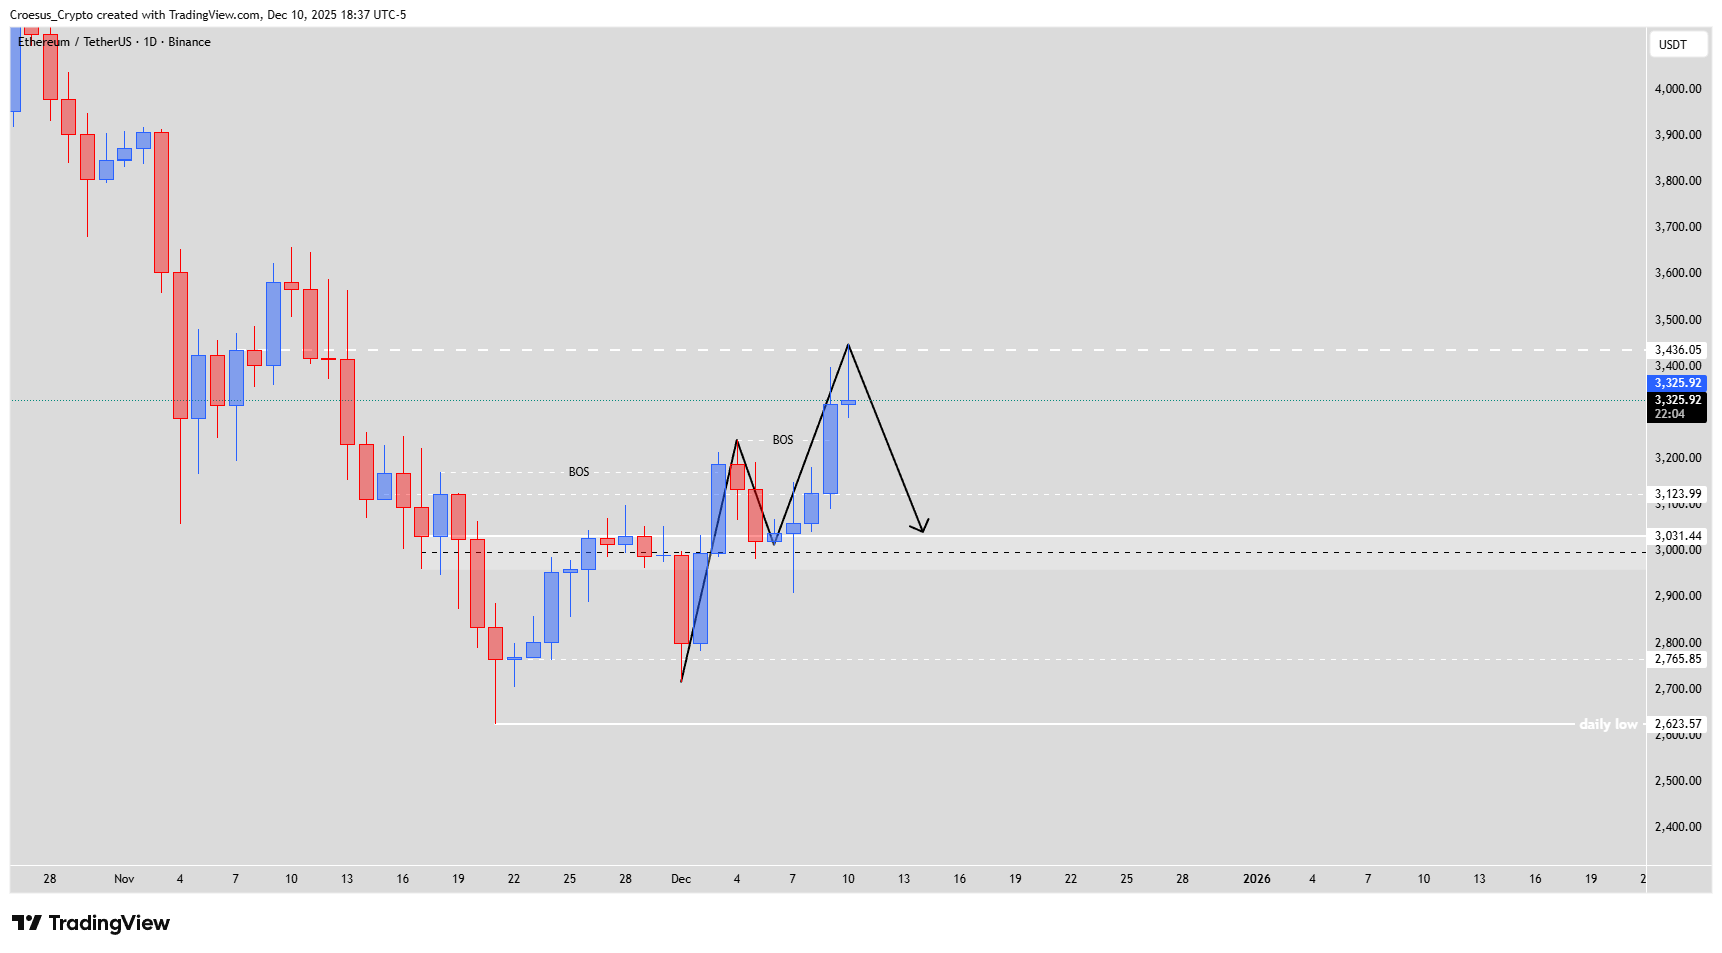
- Where do we look for the corrective level ? At this moment we see a pattern in a pattern. On the one hand we can see a bullish M being printed. If we see a fib 100% retracement of the last bullish leg, we land on or around the $3.031 $. This level is also the shoulderlevel of the inverse head and shoulder pattern (the second pattern).
- Retesting this level would mean that we are respecting the $3.000 level, a critical psychological level.
Market Structure Analysis
Our Ethereum daily analysis shows a strong impulsive leg up that extended to the Fibonacci -1 level, where price printed a classic swing failure: small real body, long upper wick.
That rejection at an extended Fibonacci target often signals exhaustion and supports the idea of an incoming correction.
Structurally, price is forming a “pattern in a pattern”: a bullish M on the recent advance, nested inside a larger inverse head-and-shoulders configuration. A full 100% retracement of the last bullish leg would bring ETH back to around $3,031, which coincides with the shoulder level of the inverse H&S.
Holding this shoulder keeps the bullish pattern valid while also defending the $3,000 psychological support, an important line where buyers are likely to react again if the correction unfolds.
Key Levels and Scenarios
Bullish scenario:
If Ethereum corrects into $3,031–$3,000 and finds support, a renewed push higher from the inverse H&S shoulder could restart the uptrend, with future Fibonacci extensions used to map new upside targets once a fresh impulse confirms.
Key levels to watch
Fib -1 extension: Current rejection zone and swing failure origin.
$3,031: 100% retracement target and inverse H&S shoulder support.
$3,000: Critical psychological support; holding here preserves the bullish structure.
Prior BOS area (around mid-range): Intermediate support resistance flip that may offer a first reaction on the way down.
Daily low region near $2,623: Deeper invalidation zone if the correction extends beyond planned support.
Trading Implications
From a trading perspective, this technical analysis favours waiting for a cleaner pullback into the $3,031–$3,000 zone, where long setups with tight invalidation below the psychological level can offer attractive risk/reward, while late longs near the fib -1 rejection carry elevated risk.
This content is for educational purposes only and is not financial advice or a recommendation to buy or sell any asset.