


In this Ethereum daily analysis for 13 January 2026, ETH is tracing a slightly different path than BTC. While Bitcoin already broke out of its range, Ethereum’s latest impulse has driven price directly into a key yearly level around $3,335, which is being tested for the first time since the last major selloff. Our technical analysis now focuses on whether this level flips to support and opens the door for an attack on the daily high, or whether it rejects price and sends ETH back into a corrective phase. We focus primarily on clean support resistance structure rather than Fibonacci projections in this setup.
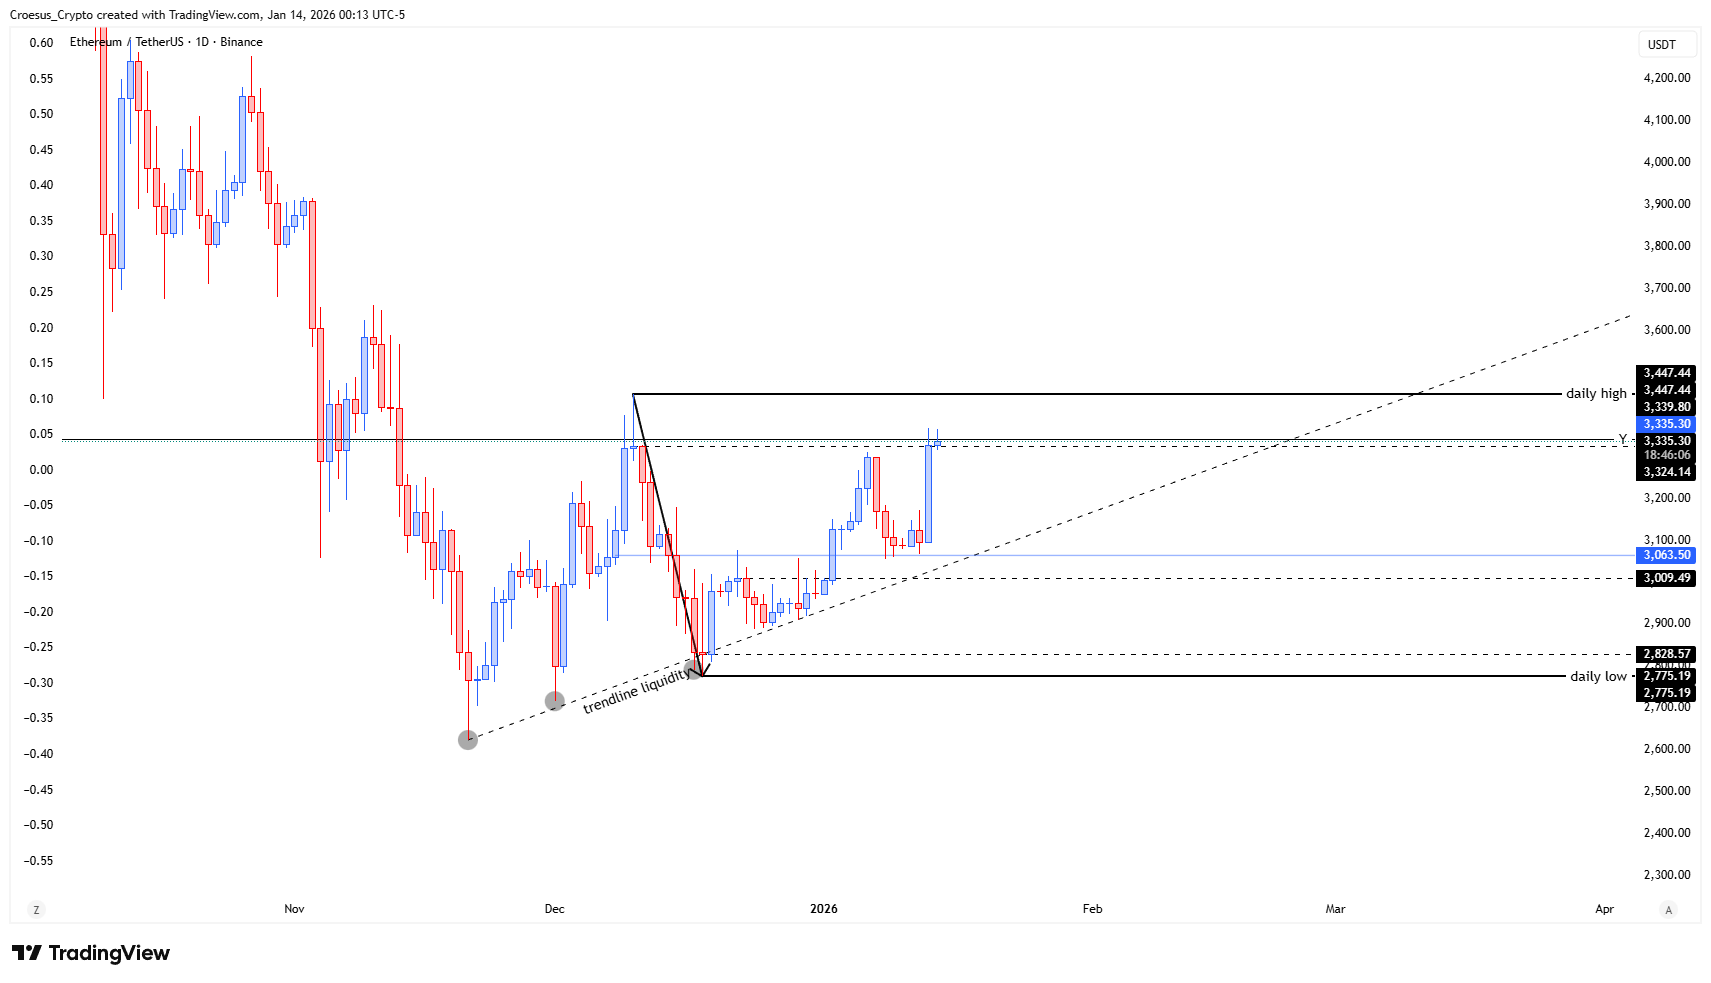
Ethereum ETH daily chart 13 January 2026 showing price testing yearly resistance near 3,335 with upside target at the 3,447 daily high and supports at 3,063 and 2,828.
Technical Analysis Key Points
- ETH's price follows a somewhat other path than BTC.
- We can see that the last impulse ended against the yearly level, touching it back for the first time.
- Same here : will we push through and see an attack on the daily high ? Or do we see a pullback, confirming the yearly level as resistance ?
Market Structure Analysis
Structure-wise, ETH printed a series of higher lows from the November bottom near the $2,775 daily low, respecting an ascending trendline. The recent impulsive leg has now tagged the yearly resistance around $3,335, where momentum stalled.
This is a classic decision zone: a convincing close above the yearly level would signal renewed strength and could invite continuation toward the $3,447 daily high and beyond.
Failure to hold above, however, would suggest that the yearly level is acting as firm resistance, opening the door for a corrective move back toward the mid-range supports.
Key Levels and Scenarios
Bullish scenario: if ETH can hold above or reclaim the yearly level after a shallow dip, we expect buyers to push for a retest of the $3,447 daily high, with potential for several percent upside from current prices before meeting stronger supply.
Key levels to watch:
$3,447 daily high: next major upside objective if yearly resistance breaks.
Yearly level around $3,335: key decision point; support/resistance flip zone.
$3,063 support: first meaningful downside target on a pullback.
$3,009–2,828 zone: deeper demand area inside the current structure.
$2,775 daily low: major invalidation of the current higher-low sequence.
Trading Implications
For active traders, patience is warranted: we prefer waiting for clear confirmation around the yearly level—either a breakout and successful retest for continuation, or a rejection that offers short-term corrective opportunities with well-defined invalidation levels.
This content is for educational purposes only and is not financial advice or a recommendation to buy or sell any asset.