


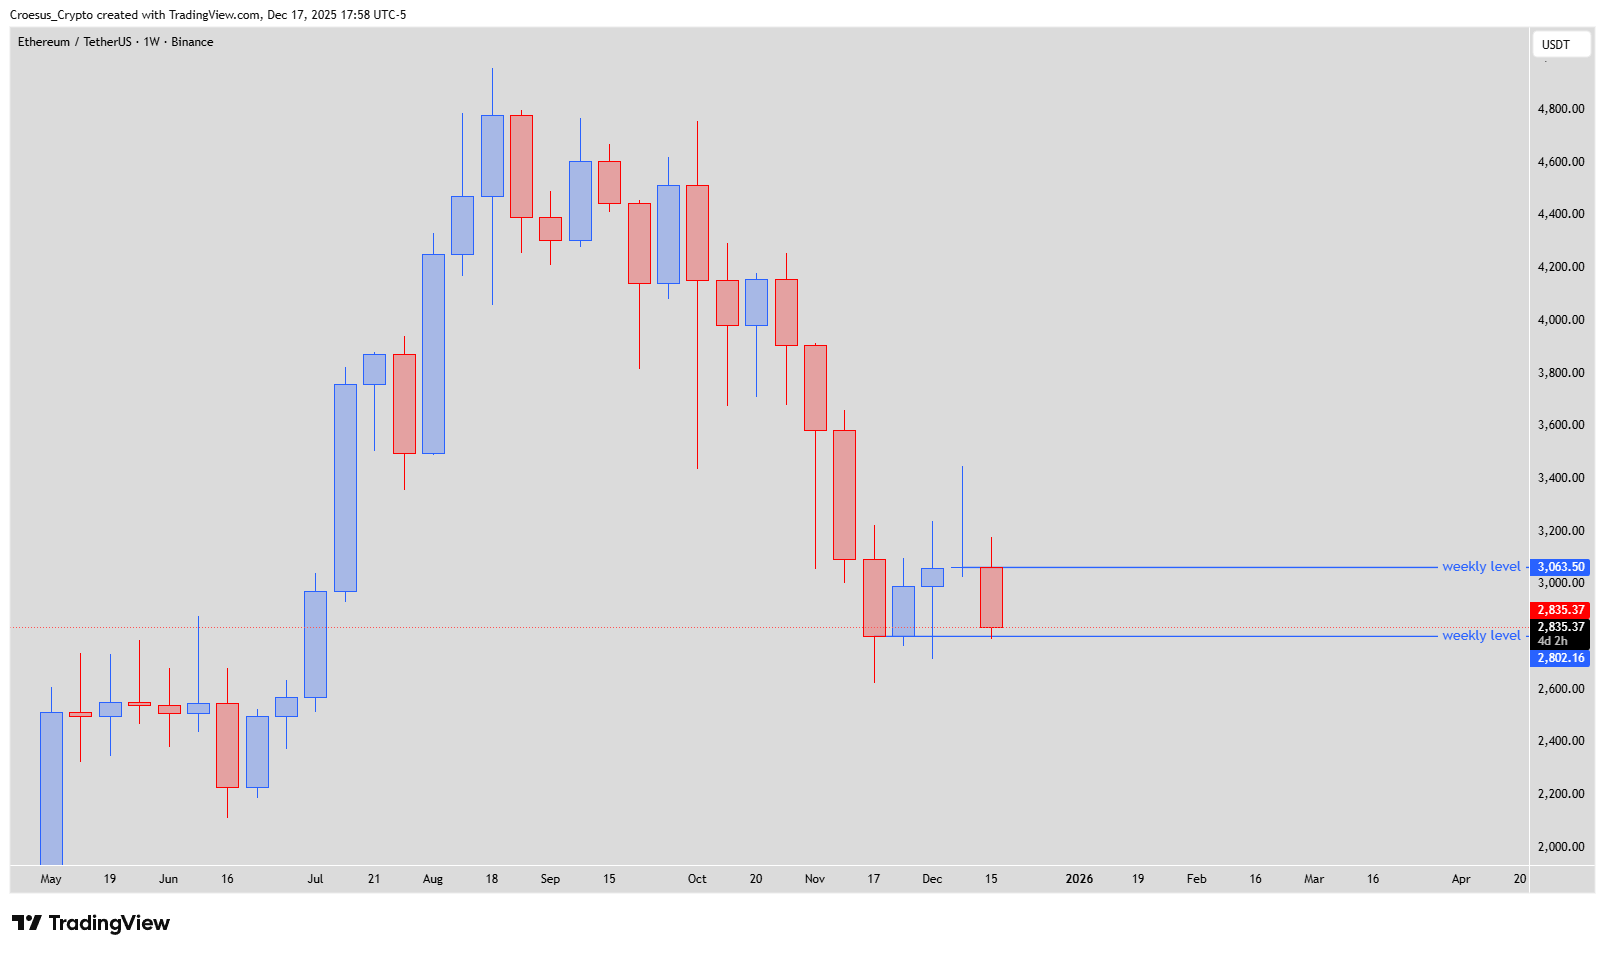
Our Ethereum daily analysis for 17 December 2025 starts from the higher timeframe. Ethereum is testing key weekly support, with today’s strong rejection candle pushing price into the lower weekly level and keeping bears in control of the current structure.
Ethereum weekly chart 17 December 2025 showing rejection from lower weekly level and candle squeezed between 2,802 and 3,063 USDT support resistance zone.
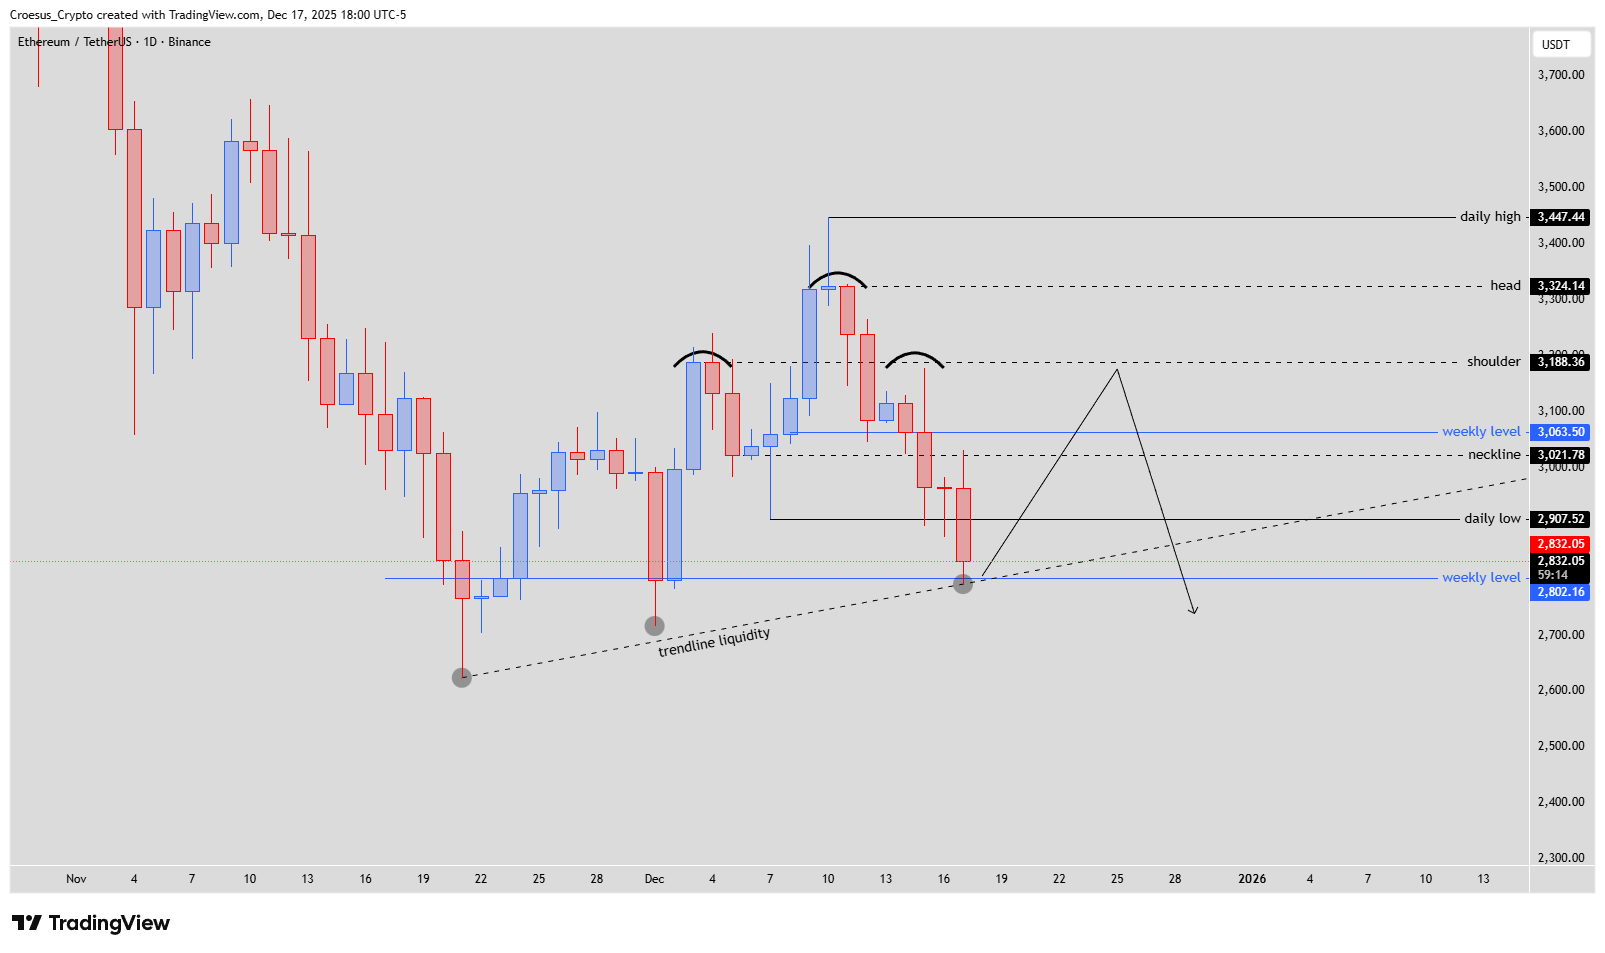
Ethereum daily chart 17 December 2025 with potential head and shoulders pattern, neckline, weekly levels and rising trendline liquidity.
Technical Analysis Key Points
- In order to understand fully where price is trading at this moment, we need to look at the weekly chart. With today's rejection candle, we saw the price hitting the lower weekly level. If we look at the weekly chart, we can see this week's candle being squized between two weekly levels.
- As we are in a bearish pattern, the risk exists that the price is printing not only a bearish W, but a natural bearish W. This means we need to retest the higher weekly level again and see a rejection there.
- Zooming in on the daily chart, we can see that potentially a head and shoulders is being printed. The day before yesterday, the price attempted to retest the shoulder level but just missed. Does this mean that we could retest the shoulder level fully now ? This would coincide with a retest of the higher weekly level.
- We can also see a trendline being printed, creating trendline liquidity below it.
Market Structure Analysis
On the weekly chart, our technical analysis shows Ethereum trading between the lower weekly level near 2,802 USDT and the upper weekly level around 3,063 USDT. This week’s candle is effectively squeezed between these two levels, underlining the importance of this range as a major support resistance box.
Within this bearish context, there is a risk of a “natural bearish W” forming: a bounce from the lower weekly level, a retest of the higher weekly level, and then a rejection that resumes the downtrend.
On the daily timeframe, Ethereum daily analysis highlights a developing head and shoulders pattern. Price recently attempted to tag the shoulder level near 3,188 USDT but fell slightly short, leaving room for a more complete retest that would align with another test of the upper weekly level.
At the same time, a rising trendline is creating trendline liquidity underneath; if broken, this could accelerate a move lower.
Traders may also overlay Fibonacci tools on this structure to refine potential reaction zones.
Key Levels and Scenarios
Bullish scenario: Price defends the lower weekly level (≈2,802) and bounces, reclaiming the neckline around 3,022 and pushing toward the shoulder zone near 3,188 and the higher weekly level at 3,063. A strong close above that region would weaken the bearish W narrative.
Key levels to watch
$3,447 – daily high and major upside target if structure fails
$3,324 – head level and strong resistance
$3,188 – shoulder area / key rejection zone for the bearish W
$3,063 – higher weekly level, crucial resistance in this range
$2,802 – lower weekly level and main support; loss opens room for continuation lower
Trading Implications
For our Ethereum daily analysis, short setups are favored while price trades below the 3,063–3,188 resistance band, with potential entries on failed retests of the neckline or shoulder and invalidation placed above the head; position sizing should reflect this clear structural risk.
This content is for educational purposes only and is not financial advice or a recommendation to buy or sell any asset.