


ETH Marketcap / Ethereum
In this Ethereum daily analysis for 16 February 2026, we see price action mirroring the structures on TOTAL and BTC. After a sharp impulsive drop, ETH is stabilising and potentially forming an ABC corrective pattern within a broader downtrend. Our technical analysis focuses on how this structure could unfold and which support resistance zones matter most in the short term.
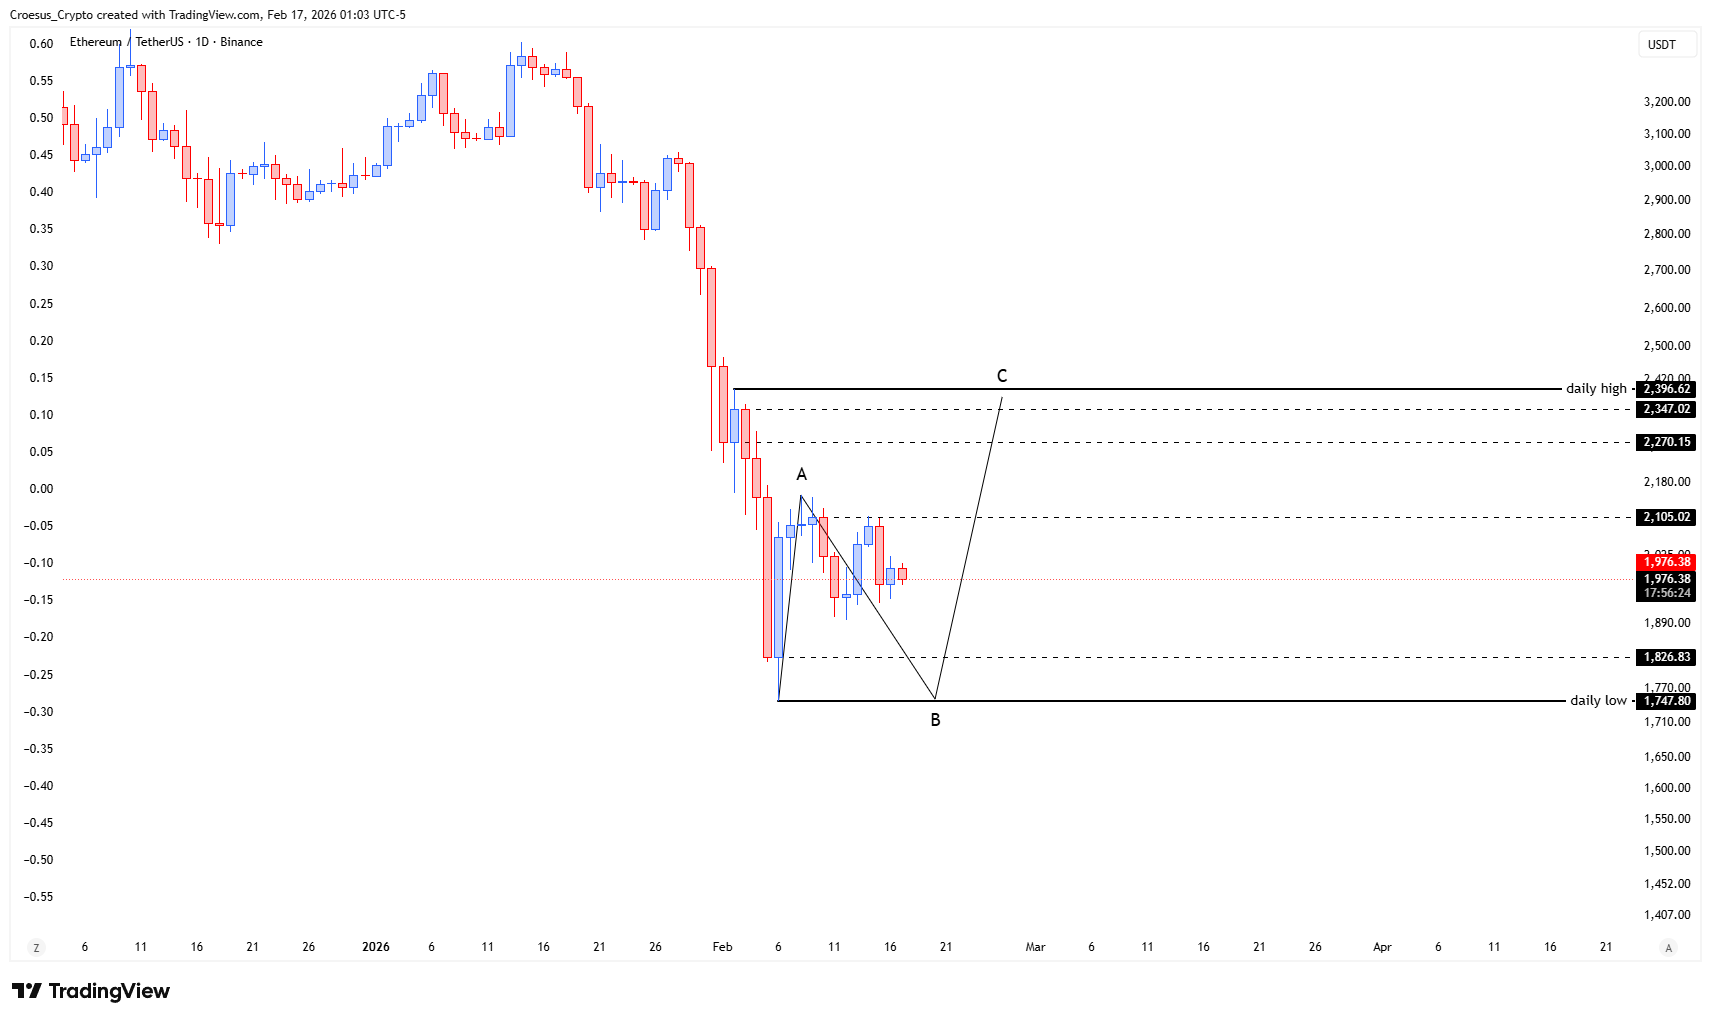
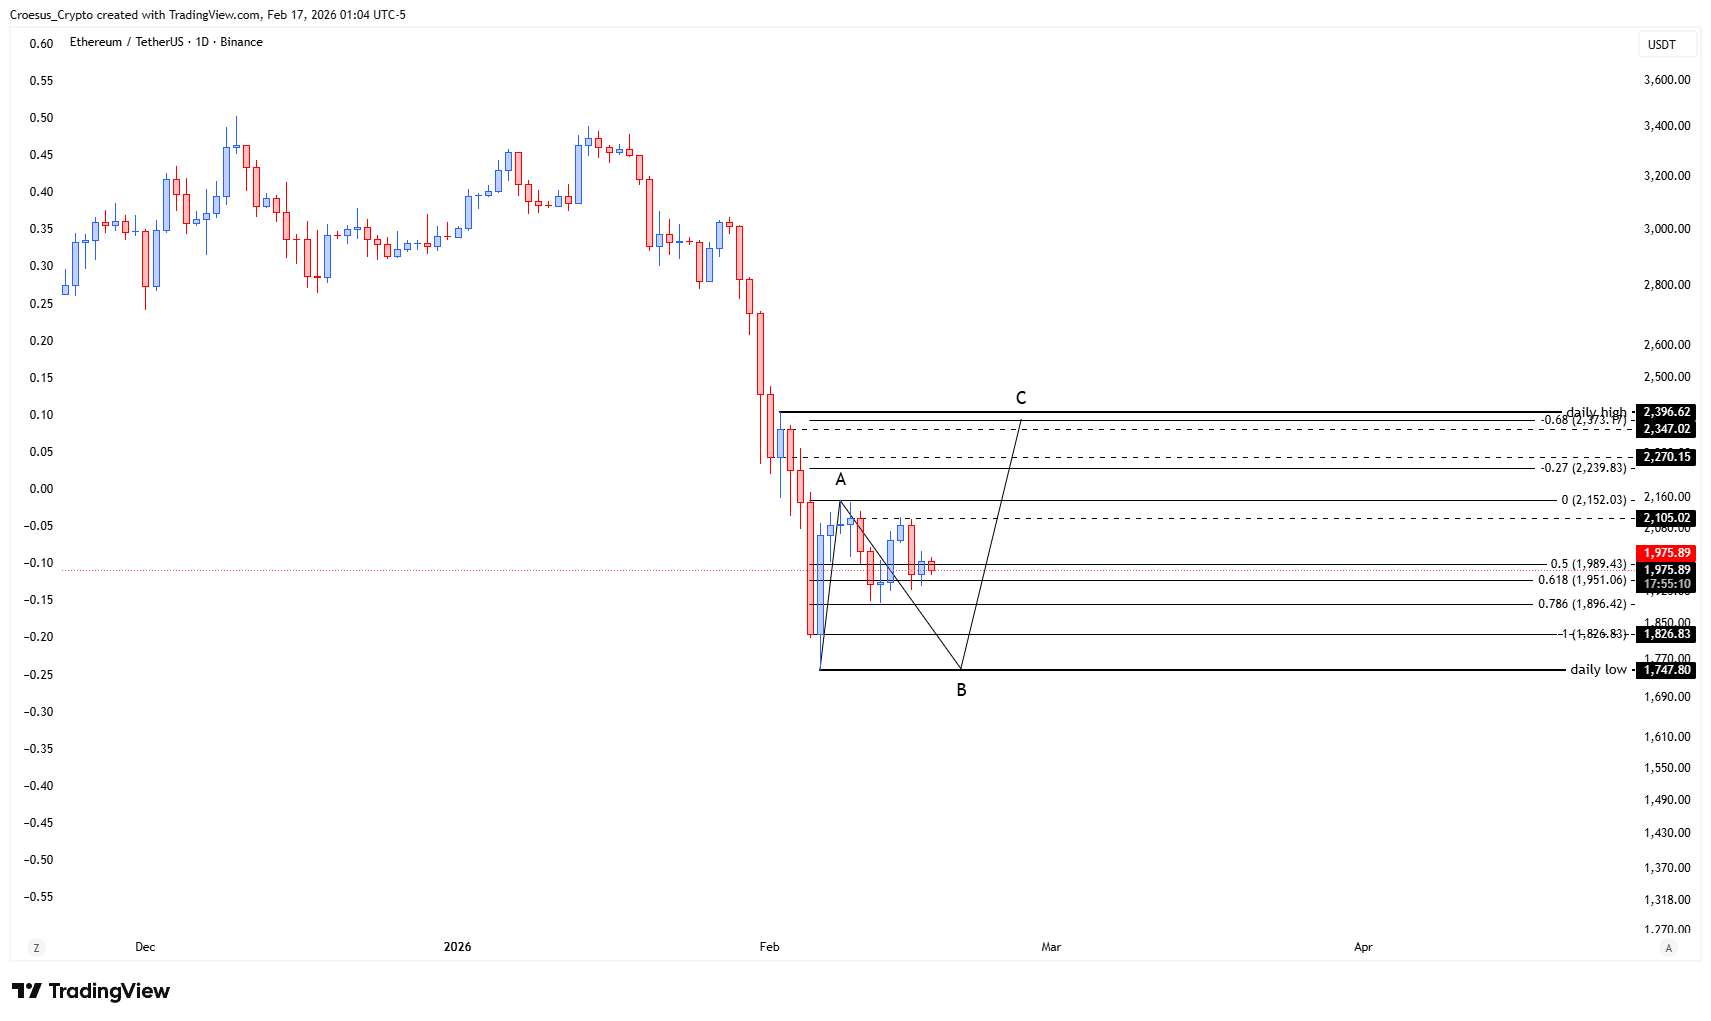
- Same scenario as with TOTAL and BTC : the ETH price could still see an ABC correction.
Market Structure Analysis
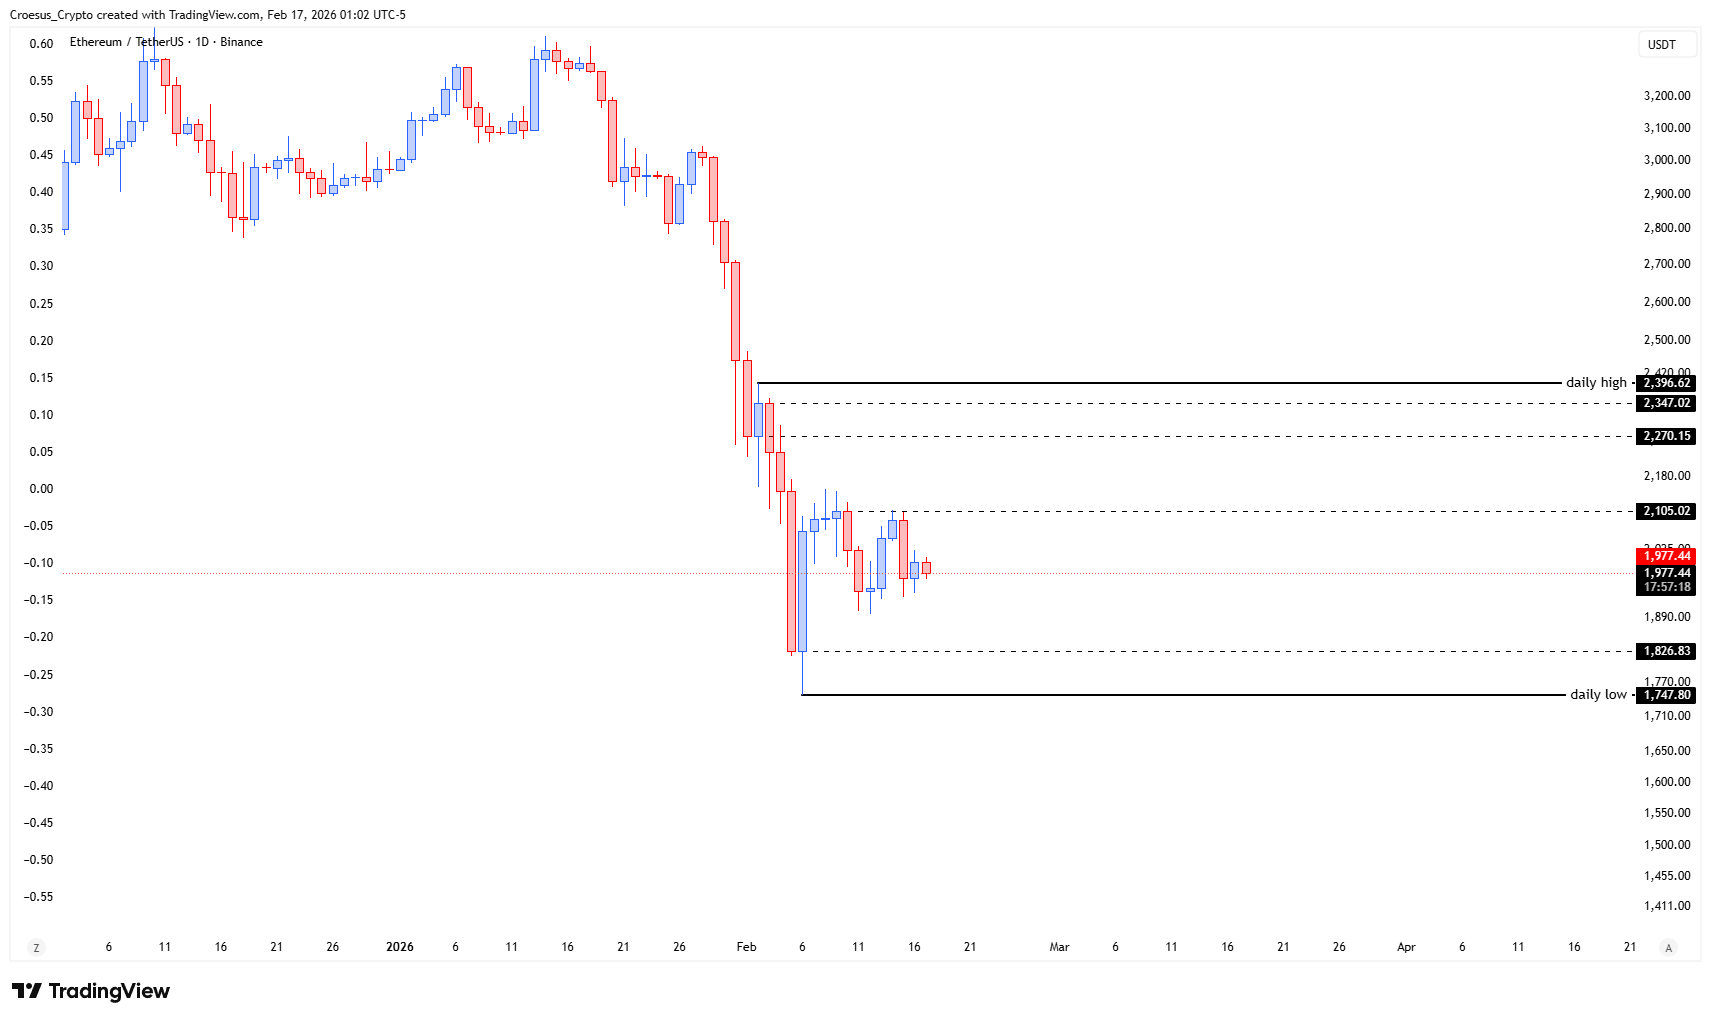
This Ethereum daily analysis shows ETH rebounding from the daily low area around 1,750–1,770 (B-leg) and trading in a tight range beneath the A-swing high near 2,105. As long as the B low holds, the market keeps the door open for a C-leg push higher. The projected C target is near the prior daily high around 2,396, overlapping with visible Fibonacci retracement and extension bands (roughly the 0.5–0.618 area of the prior dump), which creates a natural profit-taking and supply zone. Until that move confirms, ETH remains in a corrective box between the daily low and mid-range resistance, with sellers still controlling the higher timeframe trend.
Key Levels and Scenarios
Bullish scenario (corrective): If buyers defend the 1,750–1,830 region and reclaim the A-swing around 2,105 on a daily close, an ABC completion could drive price into the 2,270–2,396 band, where we expect strong resistance and reaction.
Critical levels to watch:
- $1,747 (daily low) – Primary downside invalidation; loss suggests the C-leg is starting.
- 1,775–1,826 – Short-term support and pivot; holding here keeps the B-leg thesis alive.
- 2,100 – Mid-range resistance and first objective for any bounce.
- 2,270–2,347 – Major resistance cluster, ideal zone to monitor for B-leg exhaustion
- 2,396 (daily high) – Key macro resistance; only a sustained break would weaken the broader bearish structure.
Trading Implications
Any long exposure here is a tactical play within a corrective structure: aggressive traders may look for entries near 1,750–1,830 with tight stops below the daily low, or wait for confirmation above 2,105, adjusting position size to reflect the still-dominant bearish context and respecting all key support resistance levels highlighted in this technical analysis.
This analysis is for informational purposes only and does not constitute financial advice.