


ETH Marketcap / Ethereum
In this ETH daily analysis for 18 February 2026, we zoom out to the higher timeframe and look at how Ethereum is consolidating after its recent sharp selloff. Price is moving sideways above a key daily support band, with the 4H chart only used for additional detail around intraday wicks and liquidity grabs. The main question of our technical analysis: does this daily support continue to hold, or does ETH rotate lower toward the next demand zones?
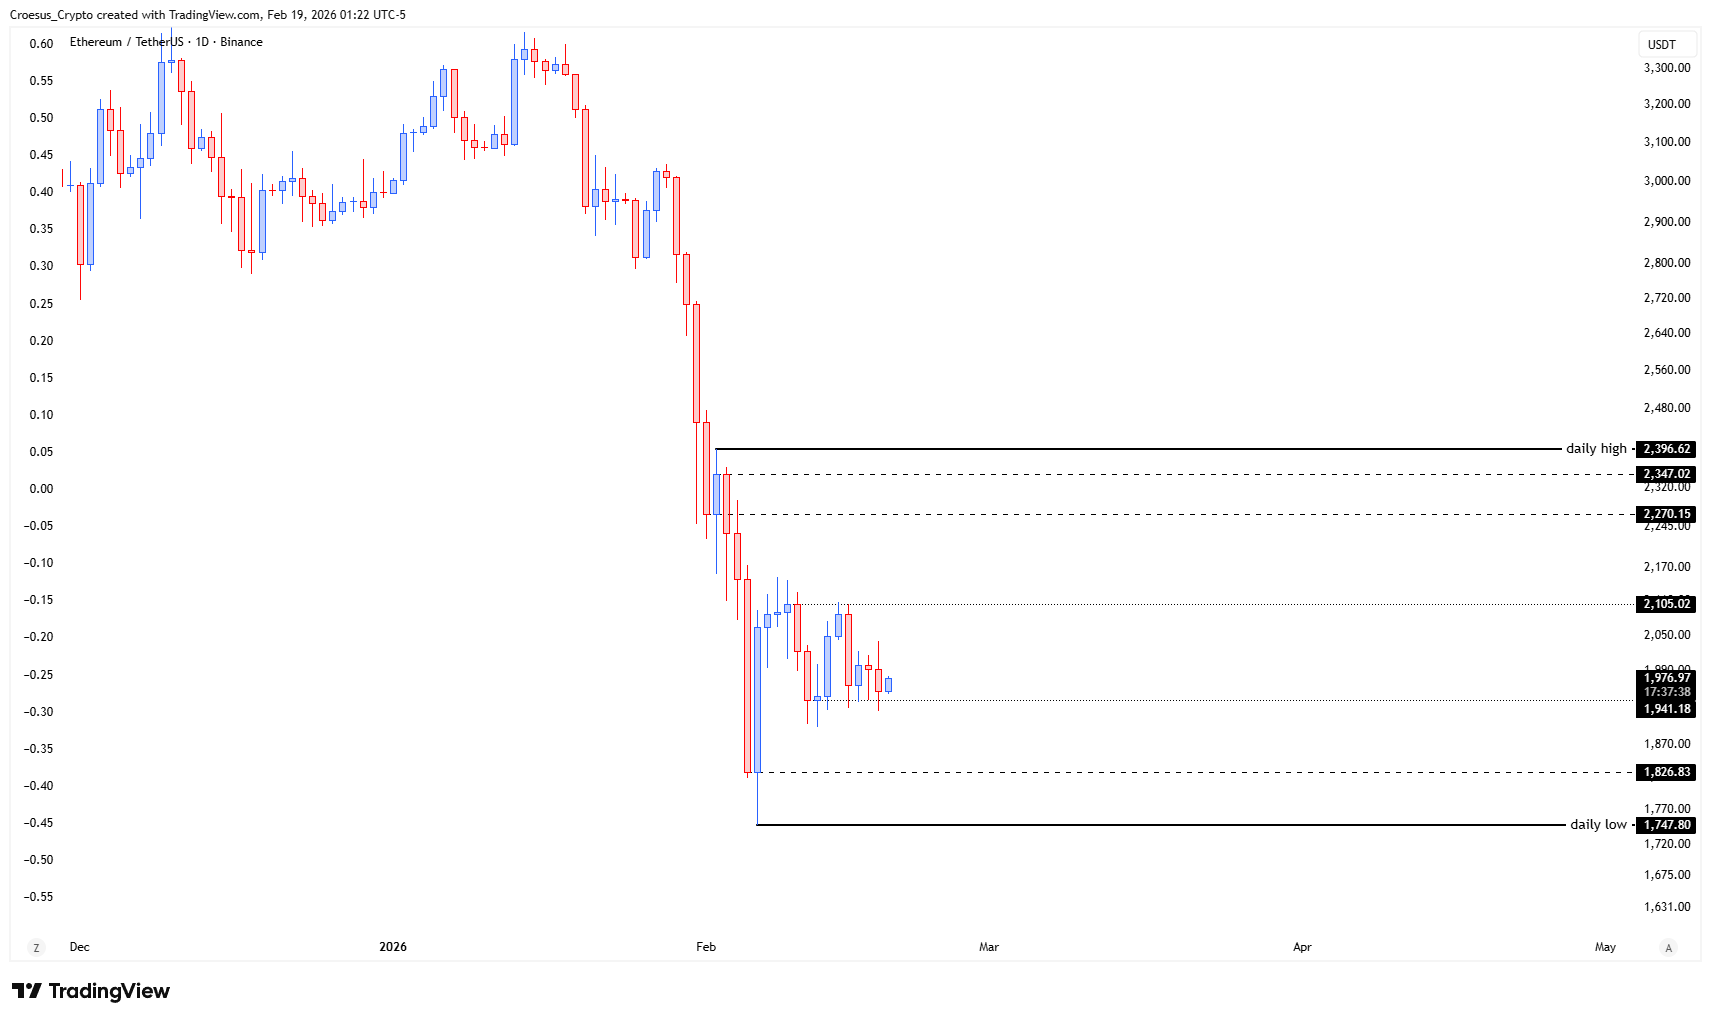
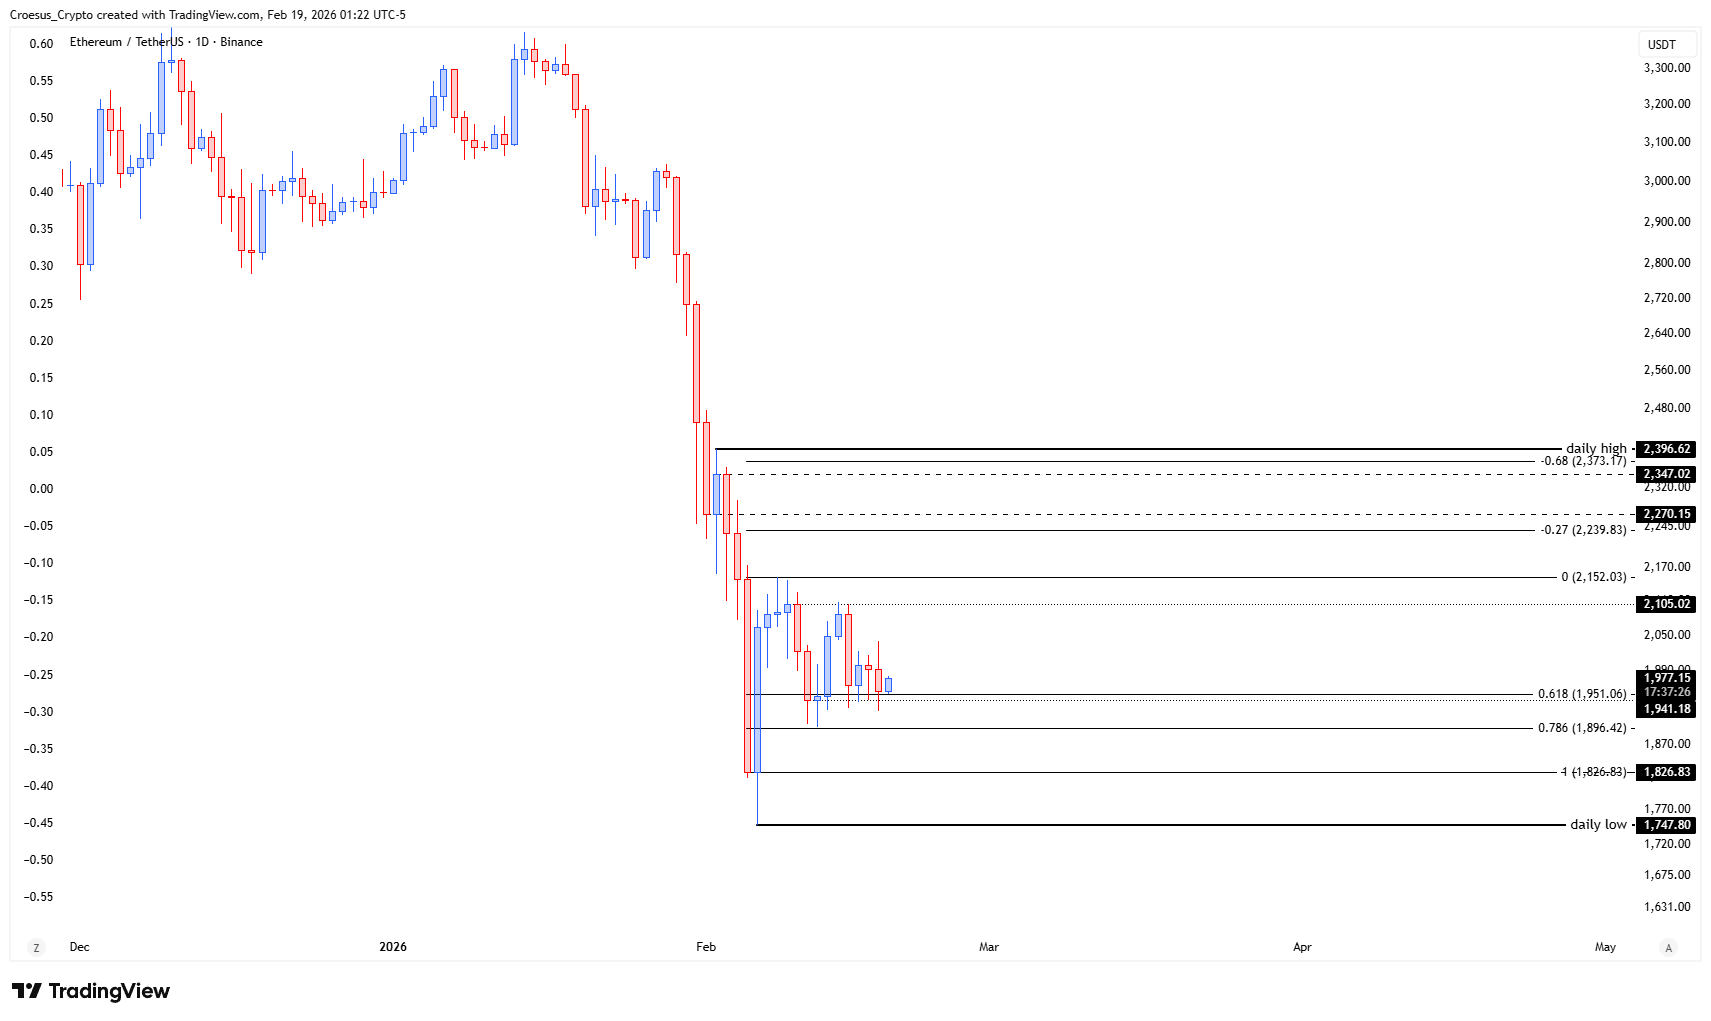
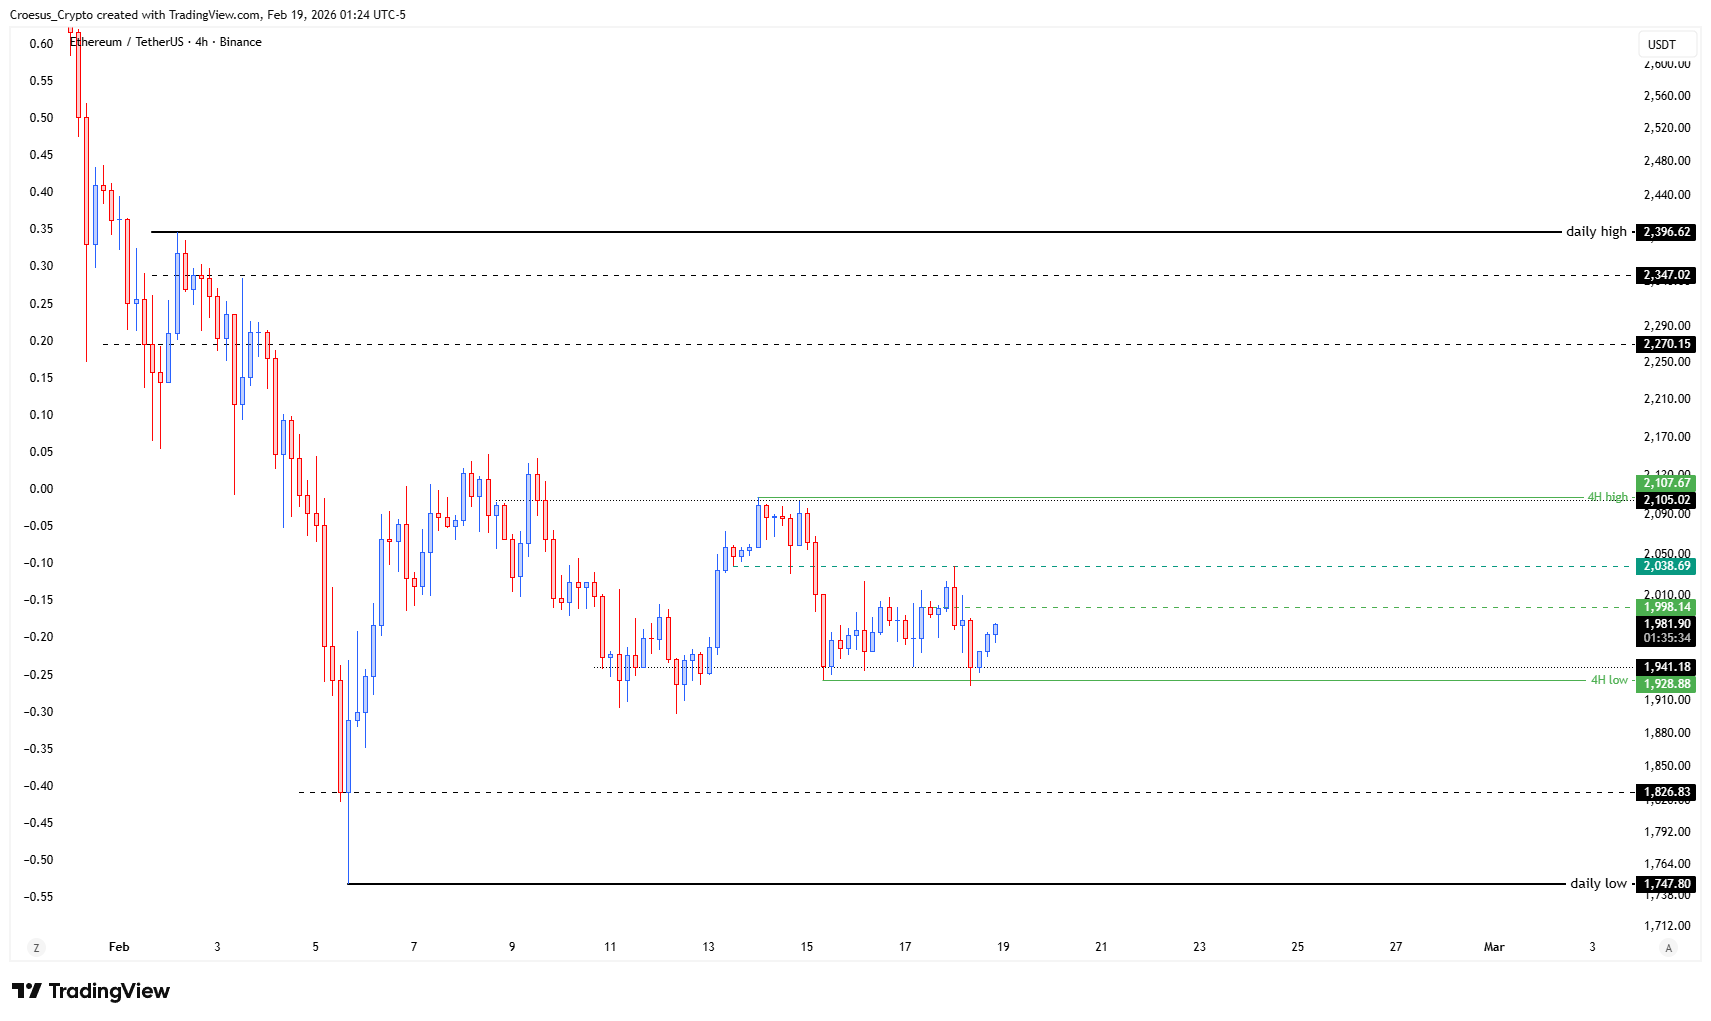
- same story as TOTAL and BTC : will this level act as support or not ?
Market Structure Analysis
On the daily timeframe, ETH has completed a strong impulsive leg down and is now forming a relatively tight range near the bottom of that move. After bouncing from the daily low around the mid-1.7k area, price is compressing between a support band roughly in the 1.93k–1.95k region and a mid-range resistance cluster around 2.05k–2.10k.
This range sits below the prior breakdown levels at 2.27k and 2.34k–2.39k, which align with important daily highs and Fibonacci retracement zones of the previous selloff. As long as candles continue to close above the current daily support band, the structure can be read as a base-building phase after an impulse down rather than clean continuation.
However, a decisive daily close below this support would indicate that the market is not yet ready to trend higher, opening the door for a move into the next structural demand zones around 1.83k and potentially back toward the daily low in the 1.74k–1.75k area.
Key Levels and Scenarios
Bullish scenario:
Buyers defend the 1.93k–1.95k daily support, and ETH starts printing higher lows on the daily chart. A reclaim and daily close above 2.05k–2.10k would be the first confirmation of renewed strength, targeting 2.27k as an initial objective and 2.34k–2.39k as the main resistance band where we expect stronger supply and Fibonacci confluence.
Critical levels to watch:
- $1,747 (daily low) – Primary downside invalidation; loss suggests the C-leg is starting.
- 1,775–1,826 – Short-term support and pivot; holding here keeps the B-leg thesis alive.
- 2,100 – Mid-range resistance and first objective for any bounce.
- 2,270–2,347 – Major resistance cluster, ideal zone to monitor for B-leg exhaustion
- 2,396 (daily high) – Key macro resistance; only a sustained break would weaken the broader bearish structure.
Trading Implications
From a daily perspective, the best setups likely come either from a clear reaction at the 1.93k–1.95k support (with tight invalidation below) or from waiting for a breakout and daily close beyond 2.05k–2.10k or below 1.93k, then trading the follow-through with appropriate position sizing.
This analysis is for informational purposes only and does not constitute financial advice.