


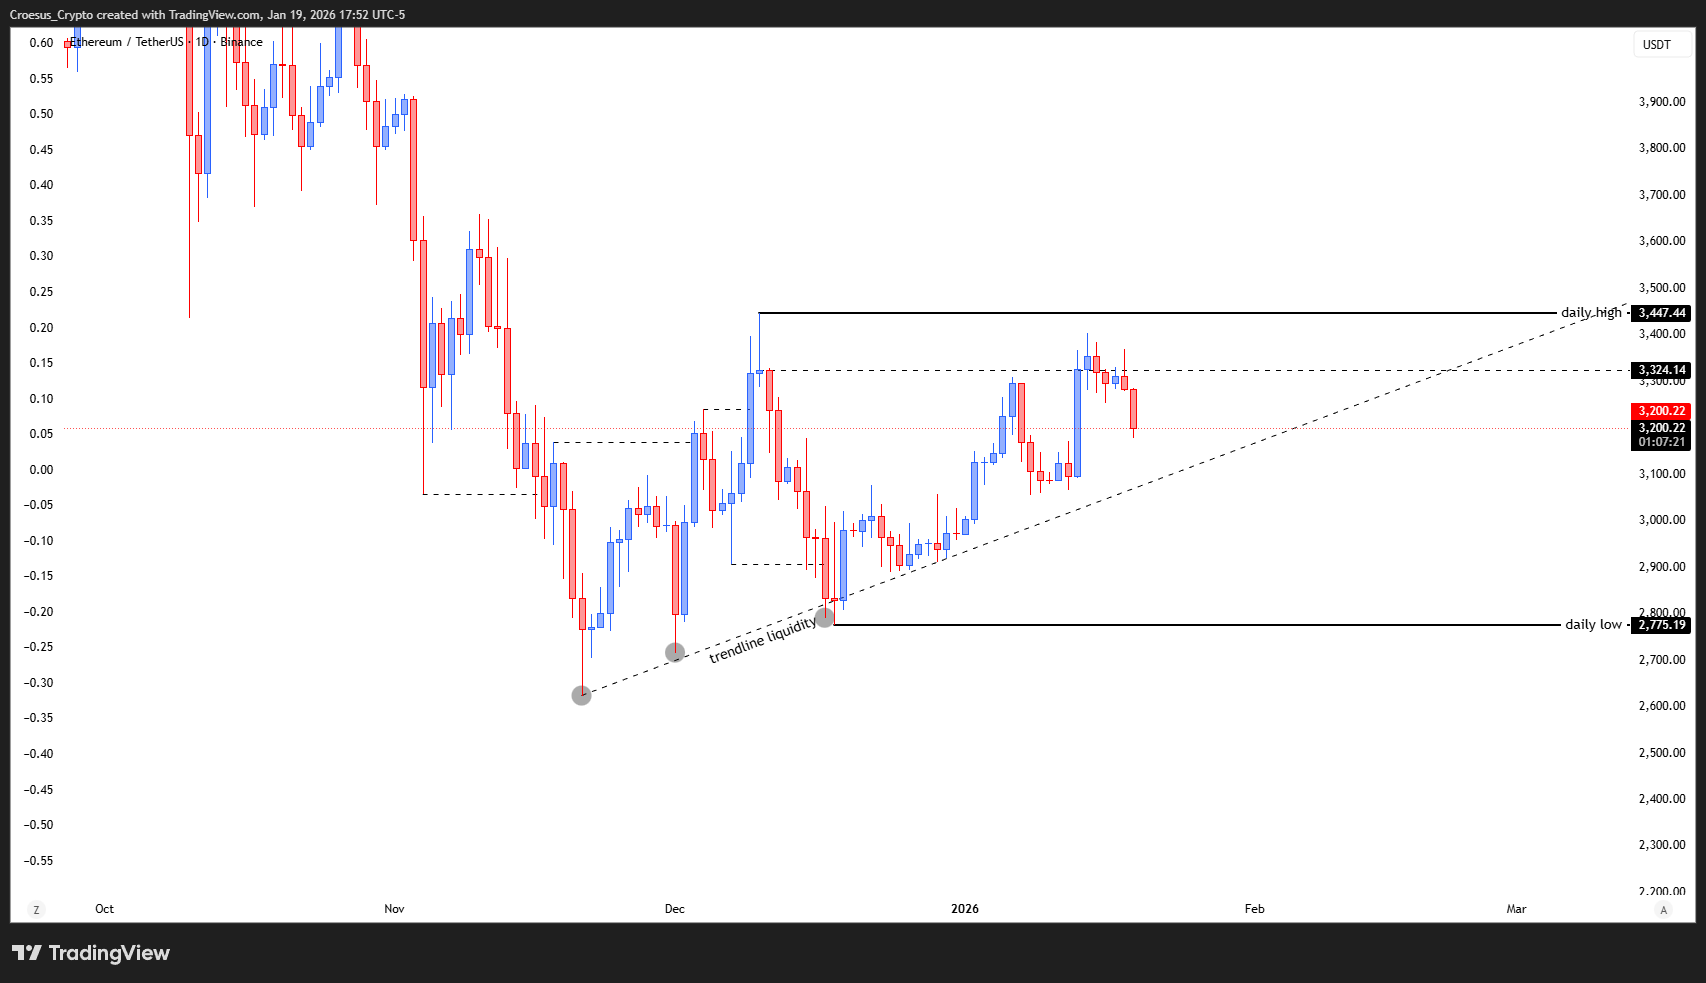
In this Ethereum daily analysis for 19 January 2026 we see ETH posting a strong sell-off today after failing to extend above the current daily high around 3,324–3,447 USDT. Despite the intraday downside pressure, price still trades within a broader rising structure, with the ascending trendline from the 2,775 USDT daily low acting as dynamic support.
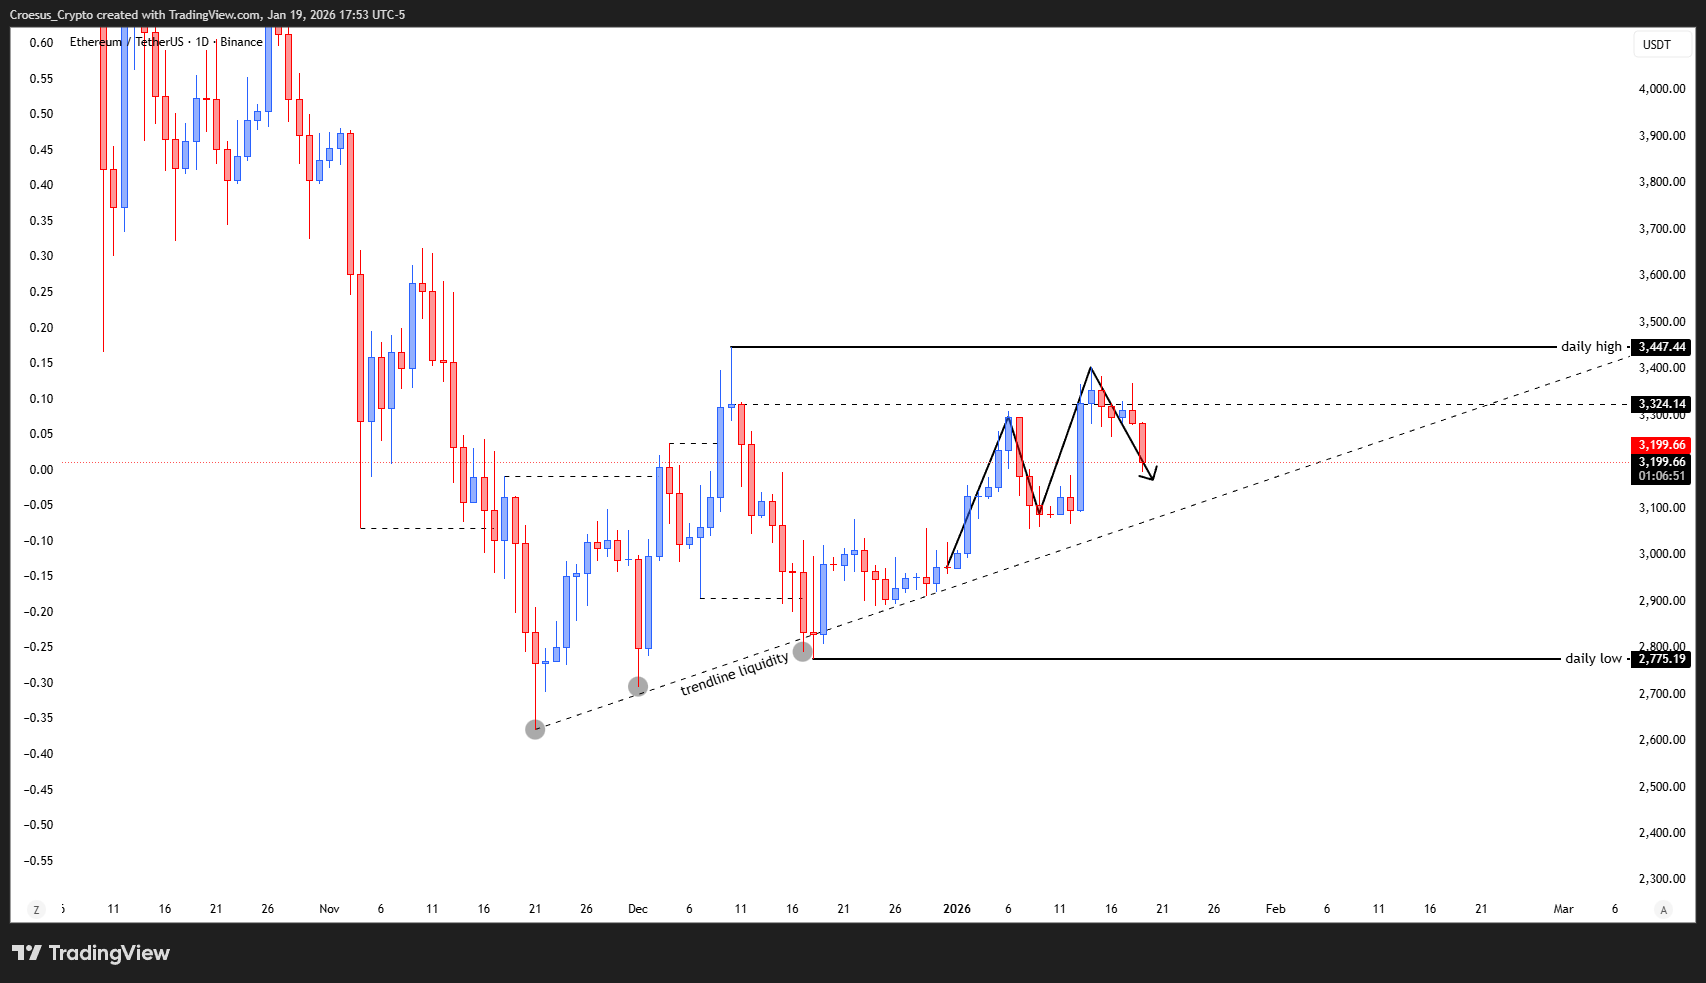
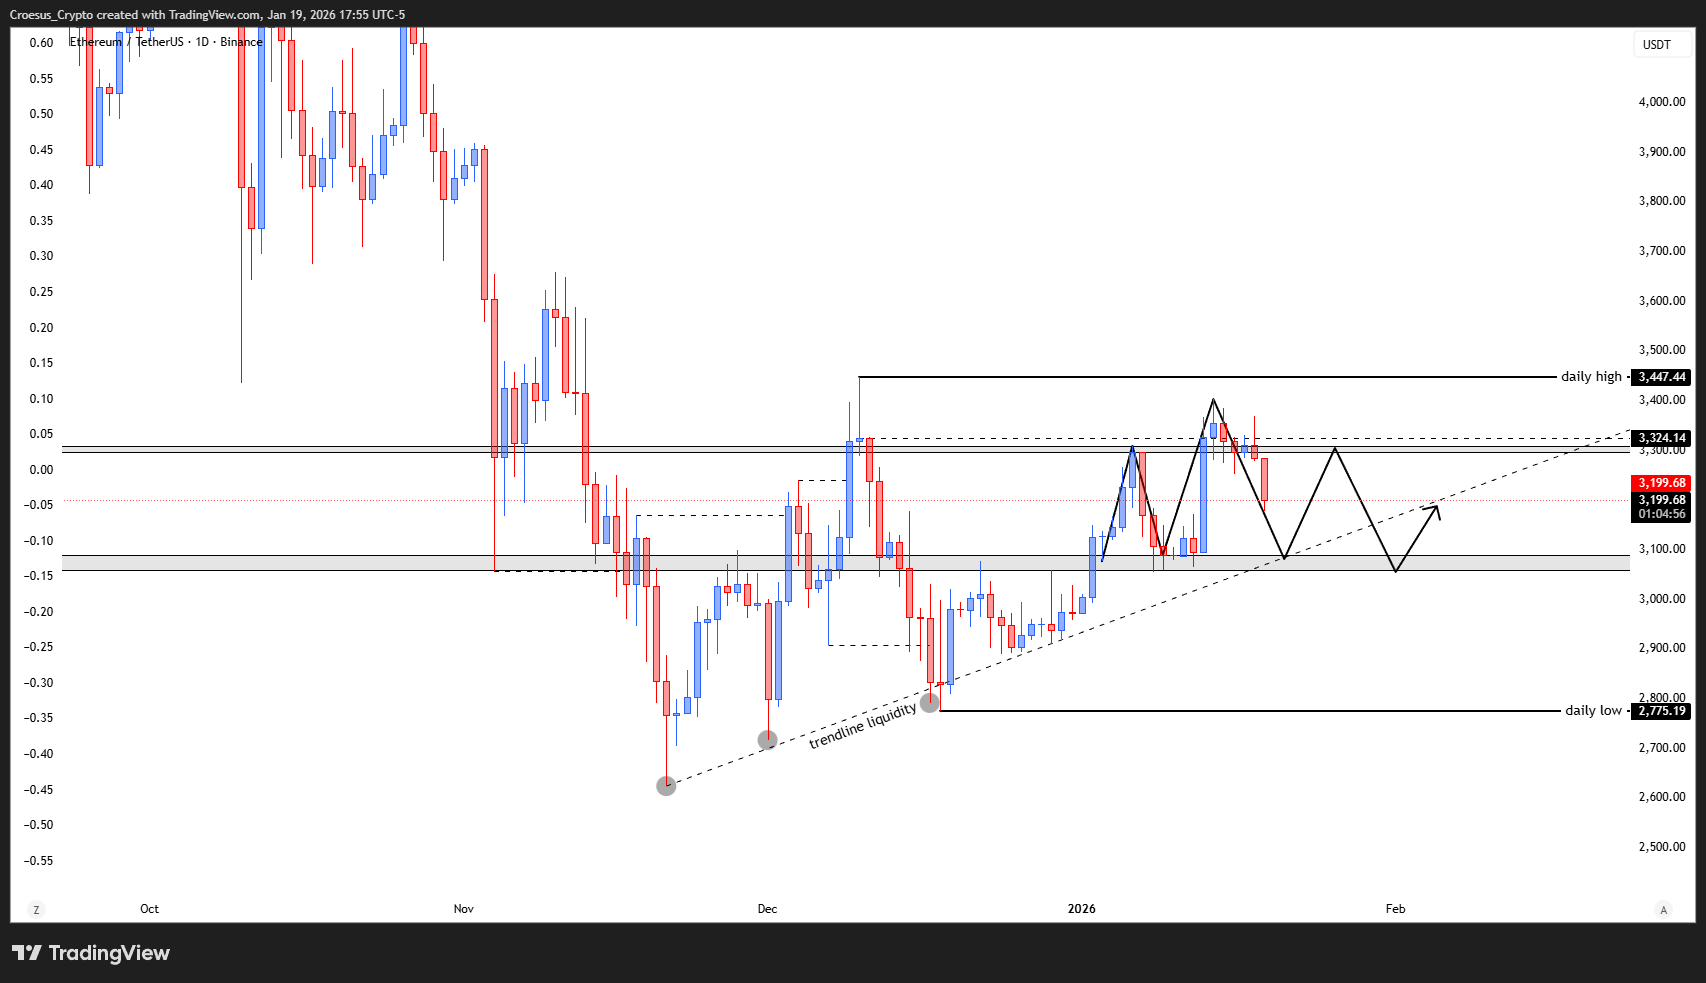
Ethereum daily analysis chart 19 Jan 2026 with rising trendline, range between 2,775 and 3,447 USDT and projected corrective path.
Technical Analysis Key Points
- Price had a substantial sell-off today.
- At this moment the prevailing trend is still bearish.
- We can see the same two set-ups appearing. Here though the critical level is not the prior daily high, as this one has not been broken yet.
- We are fractally trending bullish. Question is : will we see a break of the current daily high ? If we look for a bullish pattern, we can see a bullish M. At this the price has fallen back to the first structure after hitting the 0.618 fib level. We could see some bullish relief or even further continuation.
- ut also here we need to remain without any bias : what is the first resistance bears could use to push the price back lower ? That would be the prior high @$3.300. Here does the possibility exist that the price could use this level as a shoulder level and develop a head and shoulder.
- Just as with the other two charts, this level remains critical.
Market Structure Analysis
From a market-structure point of view, ETH remains in a corrective phase within a larger bearish trend, but short-term price action is trending higher along the rising trendline.
Our technical analysis highlights a potential bullish M pattern: the latest leg up rejected near the 0.618 Fibonacci retracement and price has now retraced back into the first structure zone just above 3,100 USDT. Holding this support and printing higher lows could lead to bullish relief and possibly continuation toward 3,324–3,447 USDT.
However, support resistance dynamics around 3,300 USDT are crucial. This prior high is the first strong level where sellers might step back in. If a lower high forms there and price rolls over, Ethereum could develop a head & shoulders pattern with 3,300 USDT acting as the shoulder level, signaling renewed downside risk toward 3,050 and potentially the 2,775 USDT daily low.
Key Levels and Scenarios
Bullish scenario:
A defense of the 3,080–3,120 USDT structure and the ascending trendline could trigger a bounce. A break and daily close above 3,324 USDT would strengthen the bullish case and open the way to test the 3,447 USDT daily high and higher Fibonacci extension targets.
Key levels to watch
3,447 USDT – Major daily high and upper resistance.
3,324 USDT – Current range high; breakout confirmation level.
3,300 USDT – Prior high; potential H&S shoulder and key resistance.
3,080–3,120 USDT – First structure / trendline support zone.
2,775 USDT – Daily low and major downside target if support fails.
Trading Implications
Given the clash between the emerging bullish M and the possibility of a head & shoulders at 3,300 USDT, we see an asymmetric environment where traders should stay flexible, use clear invalidation levels around 3,080–3,300 USDT, and avoid heavy bias until either a clean breakout or decisive rejection develops.
This content is for educational purposes only and is not financial advice or a recommendation to buy or sell any asset.