


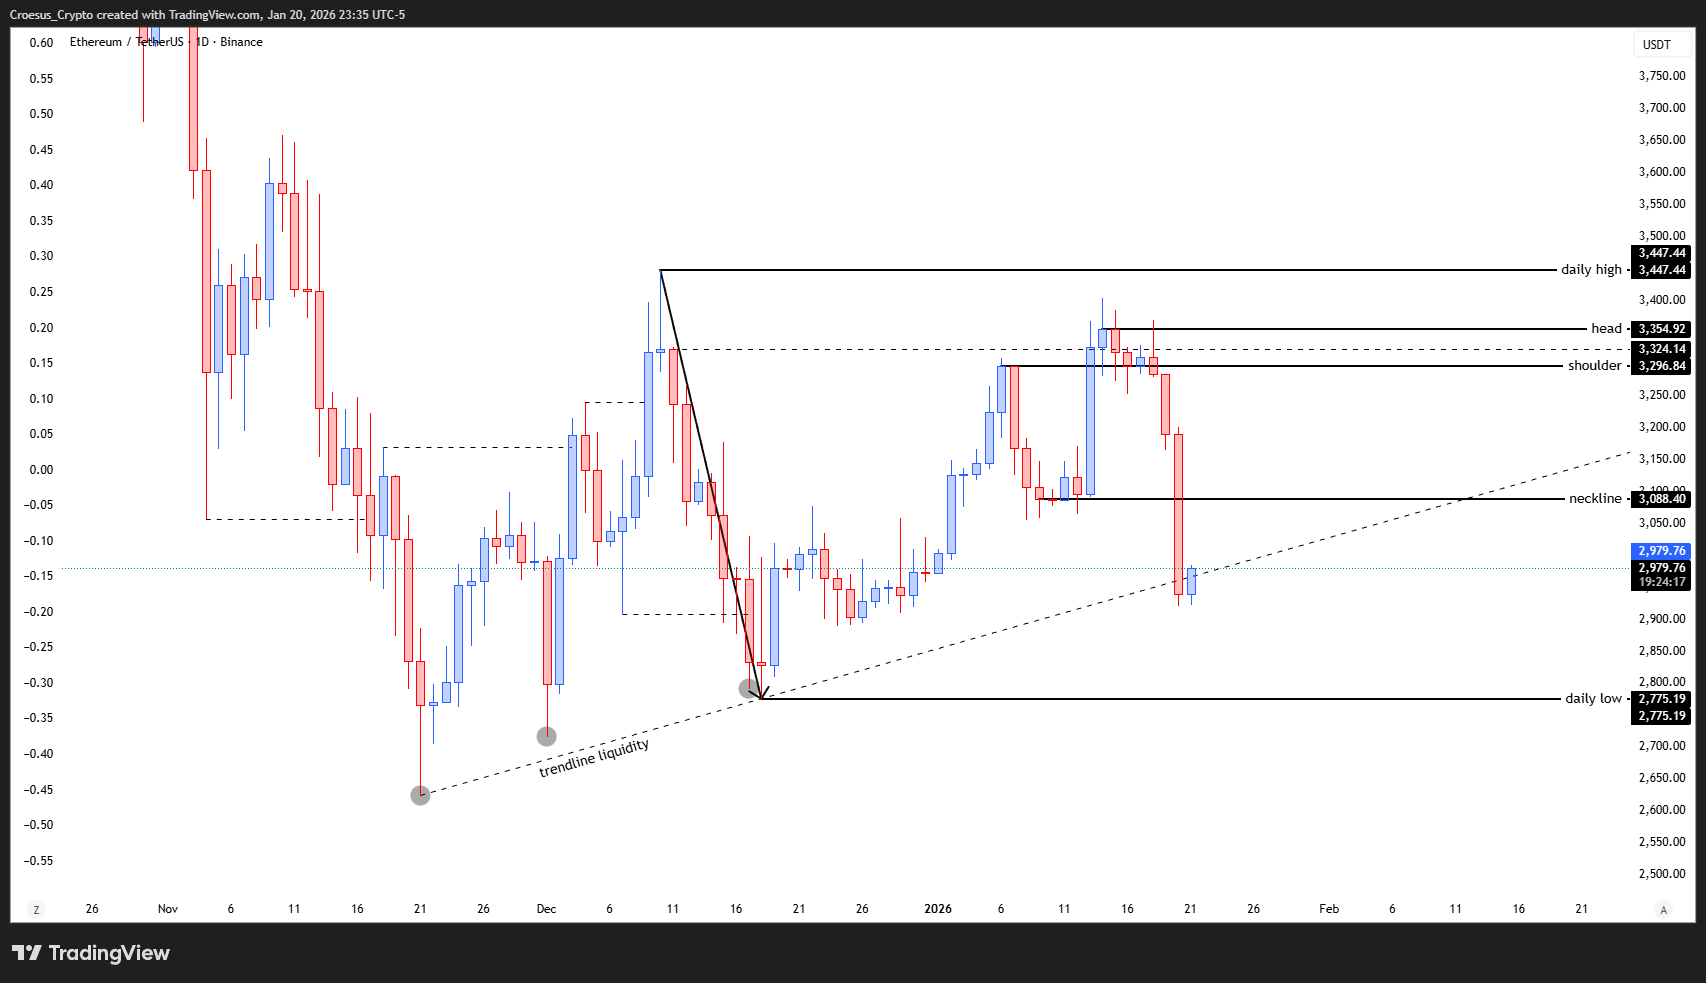
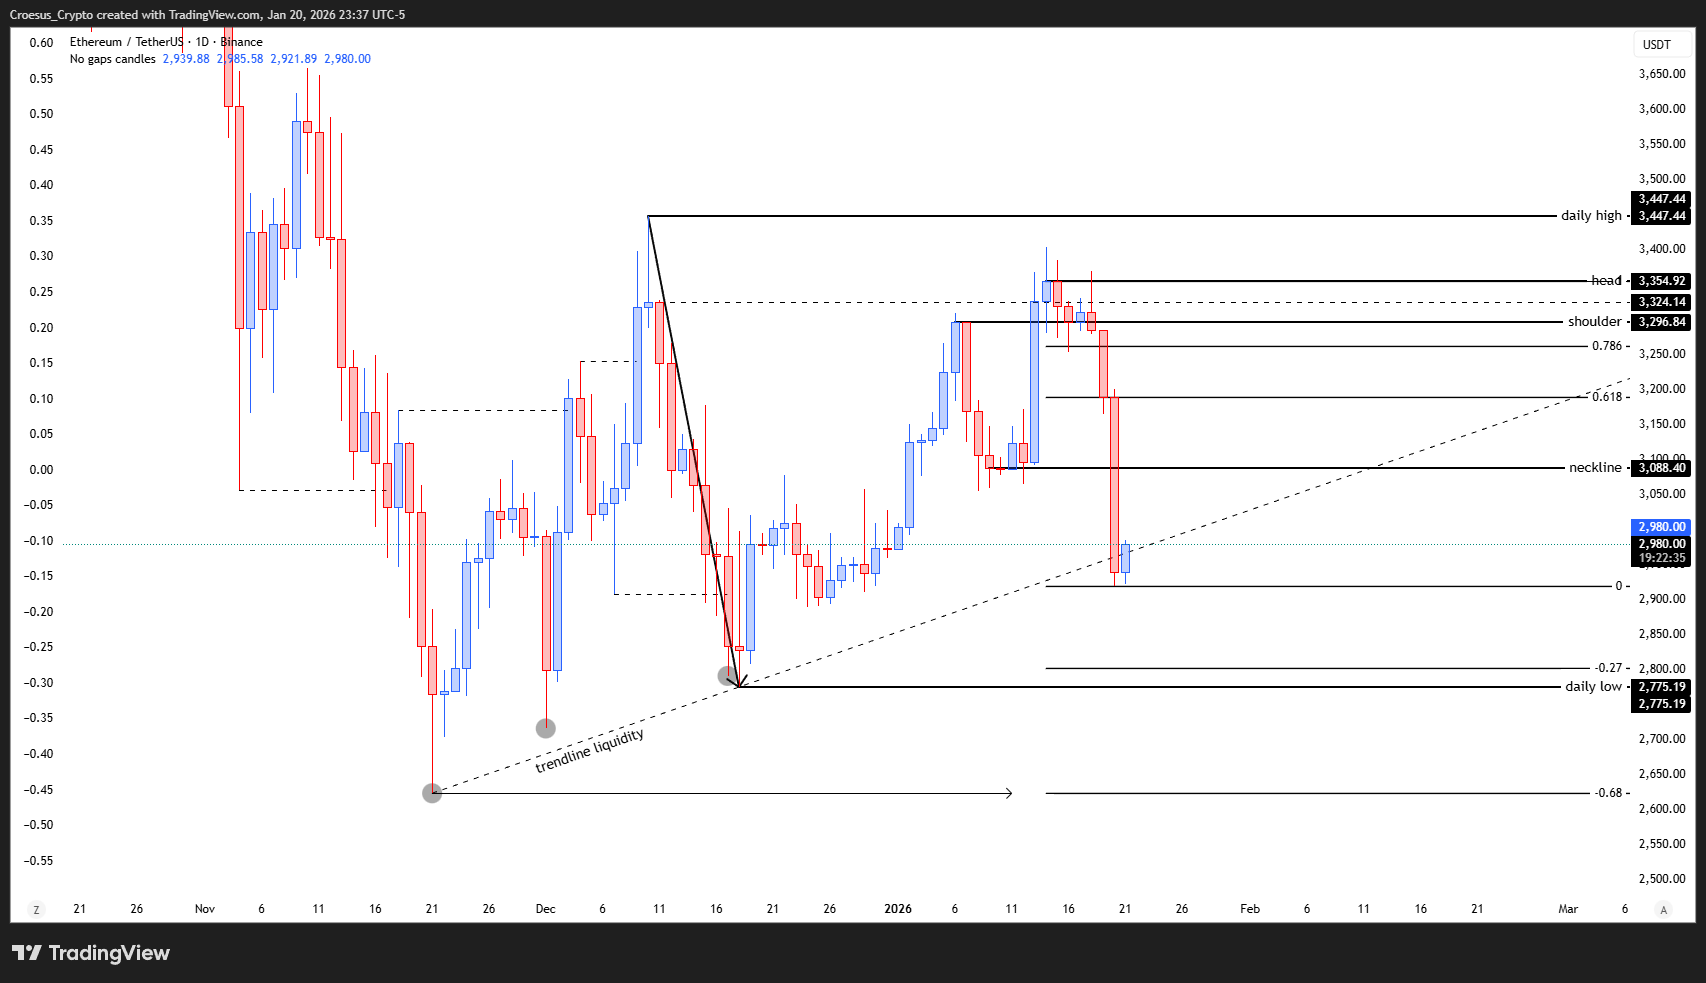
In this Ethereum daily analysis for 20 January 2026, we track how ETH followed the broader market: a failed neckline at the Fib 100% level, a break of the prior low and an ongoing test of ascending trendline support. Our technical analysis focuses on support resistance interactions, Fibonacci confluence and what a potential retracement could look like.
Ethereum daily chart 20 Jan 2026 with neckline at Fib 100%, head–shoulder structure and break of prior low.
Technical Analysis Key Points
- ETH had a relief rallye after the last bearish push down and retested the high, but got rejected there.
- Same scenario as with the TOTAL and BTC, we wanted to see the fib 100% (currently noted as neckline) to hold as support and show us a bullish entry pattern.
- But that did not come. Price broke the low and showed us a switch of momentum.
- Making the same assumption as TOTAL and BTC, if the current candle closes bullish, we could see a retracement, preferrably towards the shoulderlevel. If this pattern plays out then we might see a full correction until at least the start of the trendline.
Market Structure Analysis
ETH first staged a relief rally after the previous bearish leg, retesting the local high (head) but getting rejected there. We looked for the Fib 100% level, marked as the neckline, to act as support and provide a bullish entry pattern; instead, price sliced through that support and broke the prior swing low, signalling a clear shift in momentum.
Price is now sitting near the rising trendline that previously provided liquidity sweeps. As with TOTAL and BTC, any Fibonacci retracement drawn from the recent impulse is conditional on today’s candle closing bullish. If that close confirms, a corrective move back toward the shoulder level becomes a realistic scenario, with the neckline and 0.618–0.786 area acting as key resistance in this technical analysis.
Key Levels and Scenarios
Bullish scenario (counter-trend):
If today’s daily candle closes bullish from the trendline, we could see a retracement into the neckline and ideally towards the shoulder level, where sellers are likely to re-enter.
Key levels to watch:
Neckline / Fib 100% – broken support, now major resistance.
Shoulder level – preferred retracement target and potential lower high zone.
Recent head / retested high – upside invalidation for the current corrective move.
Ascending trendline origin – potential full correction target if the pattern fully plays out.
Daily low and Fibonacci expansion zones – downside continuation targets if trendline support fails.
Trading Implications
We treat ETH as short-term bearish, with any longs viewed as counter-trend bounces that require confirmed bullish closes and tight risk management around the neckline and trendline levels.
This content is for educational purposes only and is not financial advice or a recommendation to buy or sell any asset.