


In this Ethereum daily analysis for November 2025, we focus on the strong reaction after price completed the Fibonacci -1 extension of the last bearish W. Our technical analysis shows a convincing bounce, but the broader market structure still points downward, so we treat current price action as a corrective phase within the prevailing bearish trend.
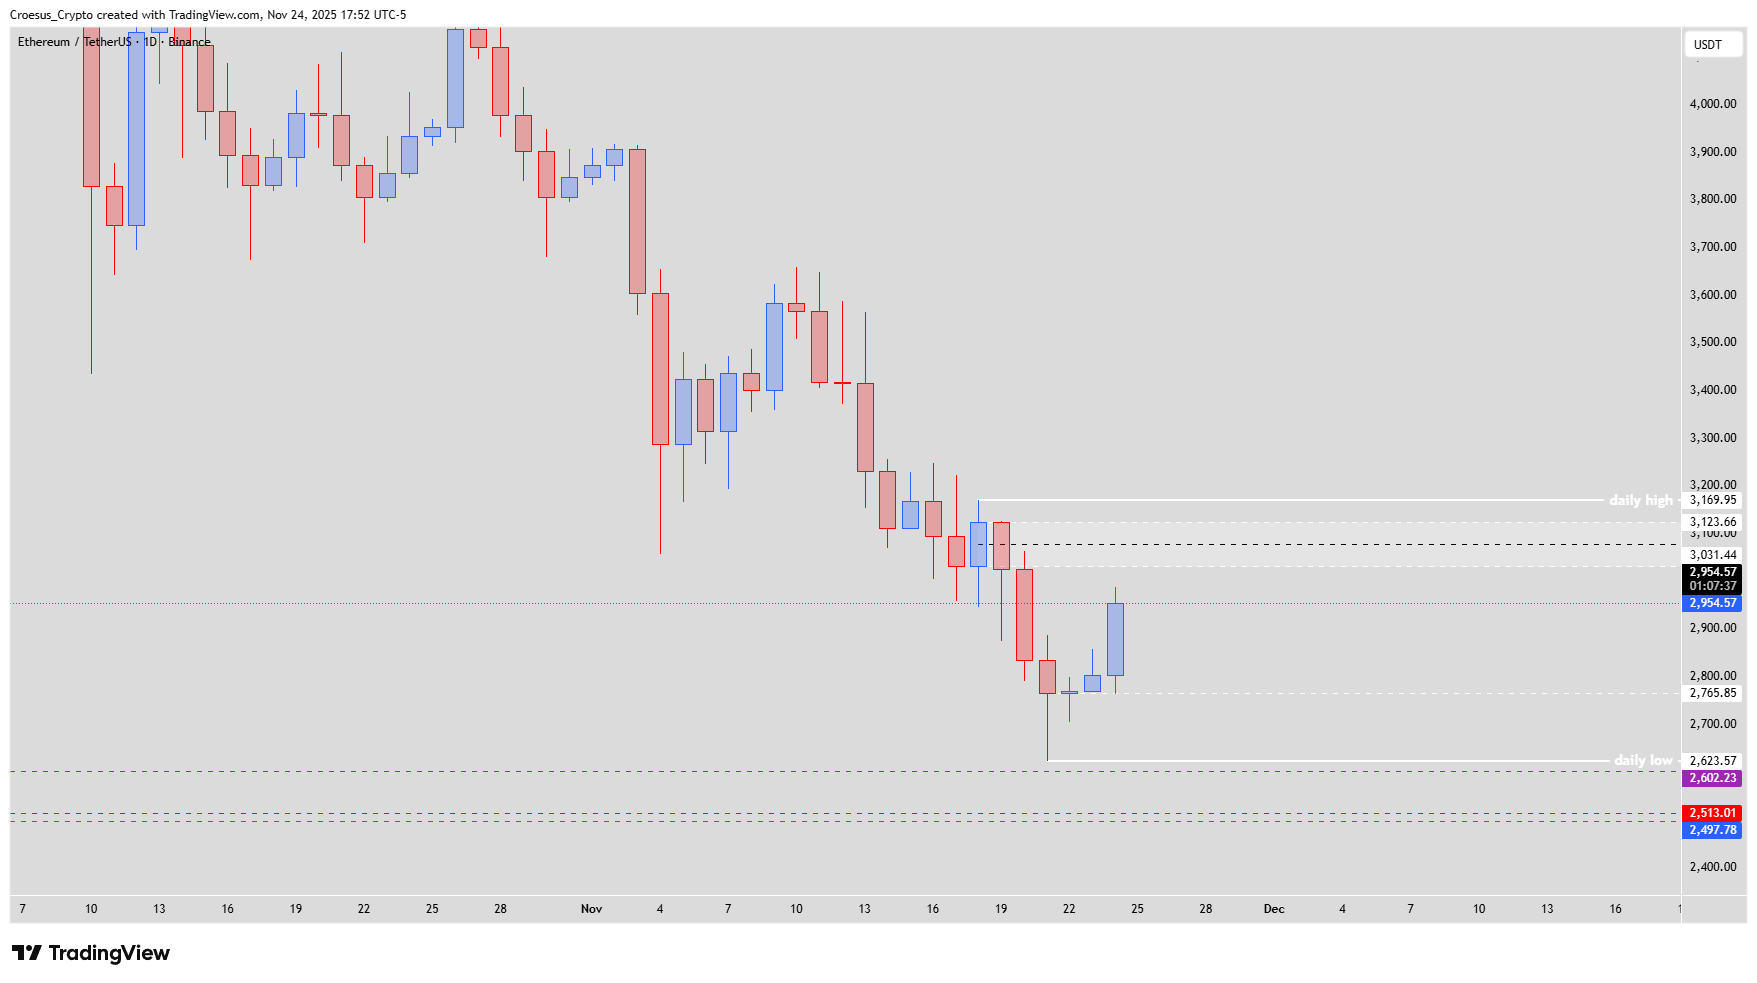
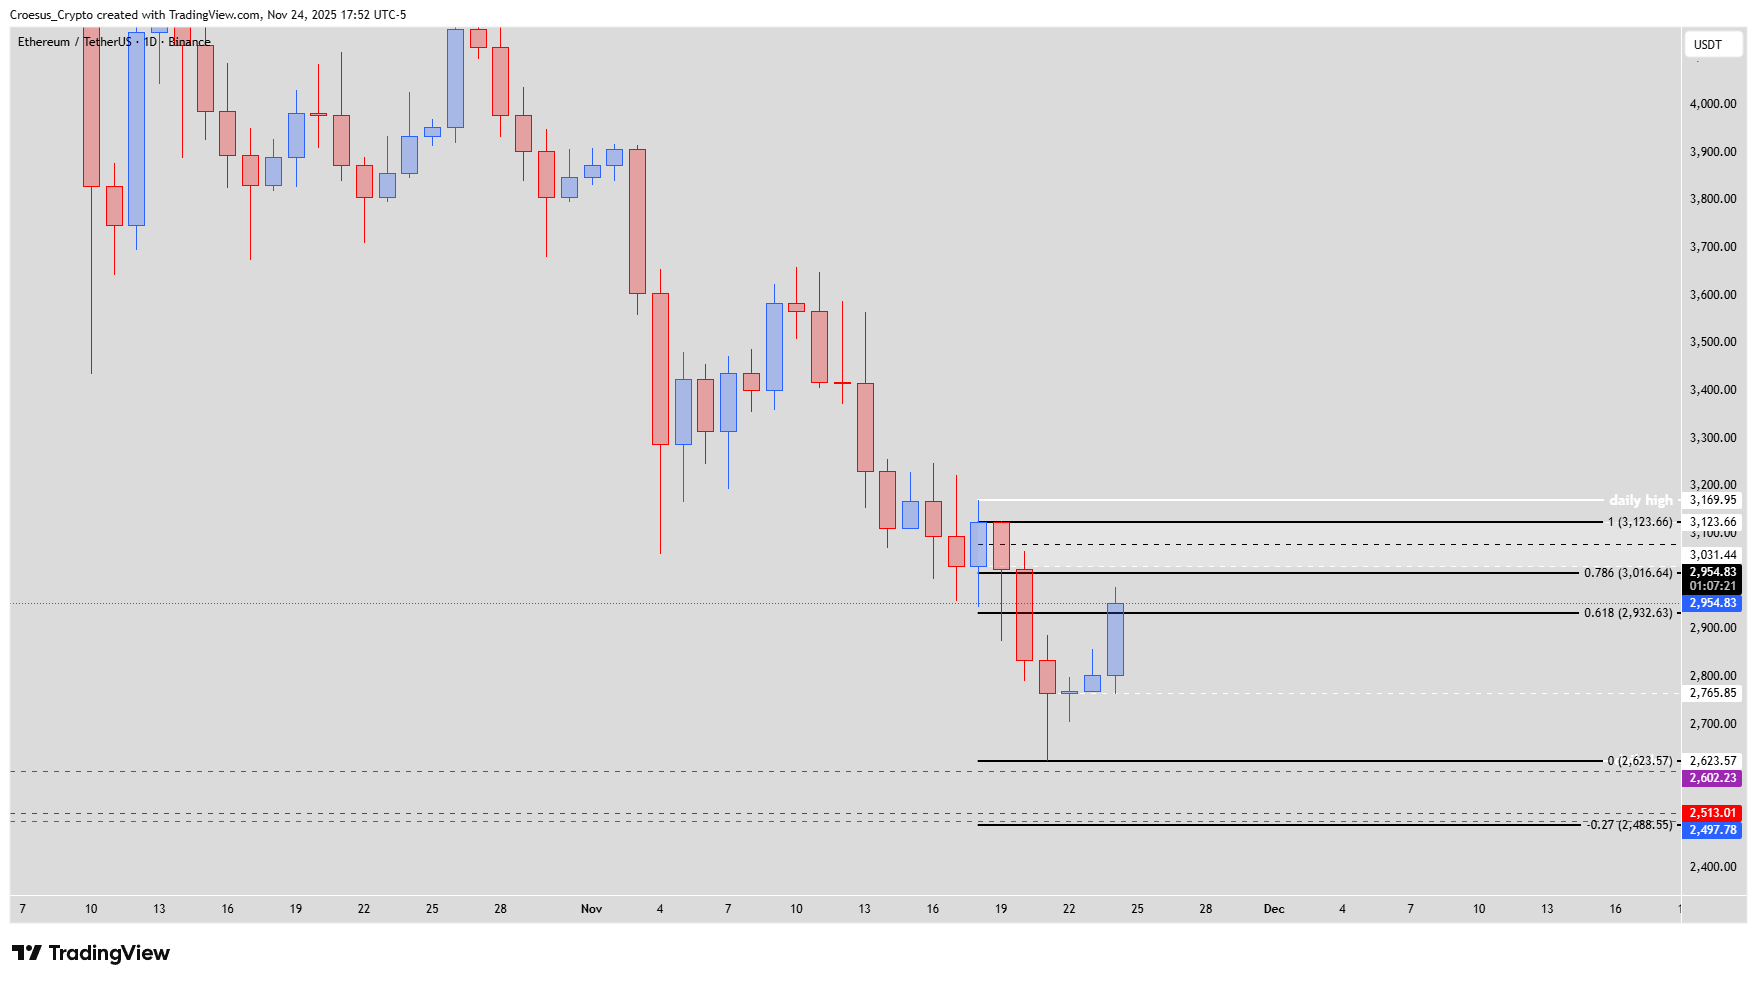
Ethereum daily chart November 24 2025 with Fibonacci -1 completion bottoming, bullish correction and resistance near 3,000 $ and 3,169.95 $
Trend = bearish ↓
Technical Analysis Key Points
- Price hit the fib completion -1 of the last bearish W, forming a bottoming of the price and a reversal.
- This bullish reversal might seem to be impulsive, but still needs to be considered as a bullish correction of the last bearish push down
- In order to see a bullish reversal the daily high @ 3,169.95 $ needs to be reclaimed and defended.
- A retest of the zone around 3,000 $ seems more than likely, possibly initiating a further bearish continuation. If we look at the fib retracement of this bearish W, we can see that the fib completion -0.27 not only is confluent with a weekly key level but also a monthly and 3monthly key level.
Market Structure Analysis
The recent sell-off completed its bearish W leg right at the Fibonacci -1 extension, where Ethereum formed a local bottom and reversed sharply. Despite the strength of this bounce, Ethereum daily analysis still shows a sequence of lower highs and lower lows, keeping the dominant trend bearish. Current price action is best read as a bullish correction, retracing part of the previous impulsive leg down.
The 3,000 $ area stands out as a key support resistance zone. A reaction here could easily trigger renewed selling pressure and resume the larger downtrend. Below, the Fibonacci -0.27 completion aligns with a cluster of weekly, monthly and 3-monthly key levels, creating a strong higher-timeframe demand zone that could act as a major decision point if price revisits it.
Key Levels and Scenarios
Fib -1 completion zone – Recent bottom and origin of the current bounce.
3,169.95 $ – Daily high; must be reclaimed and defended to confirm a bullish reversal.
3,000 $ zone – Likely retest area where a fresh bearish reaction can start.
Fib -0.27 completion confluence – Strong higher-timeframe support with weekly, monthly and 3-monthly key levels.
Trading Implications
As long as Ethereum trades below 3,169.95 $ and treats 3,000 $ as resistance, we favor viewing rallies as corrective with better risk/reward on patient entries near resistance and clear invalidation above the daily high.
This publication is for educational purposes only and does not constitute financial advice or a recommendation to buy or sell any asset.