


ETH is trading in the middle of the corrective range that formed after the strong bounce from the $2.765,85 area. Price is rotating around the key retracement cluster between roughly $2.989,16 and $3.053,92. Liquidity has been taken on both sides of the short term range, which suggests stop hunts rather than a clear trend decision. The current focus is whether buyers can defend the emerging 4H inverse head and shoulders around $3.000,00, or whether sellers will push price back towards the lower fib levels and the prior daily low.
Daily zoom ETHUSDT – BOS in place, but price still capped below daily high at $3.240,35
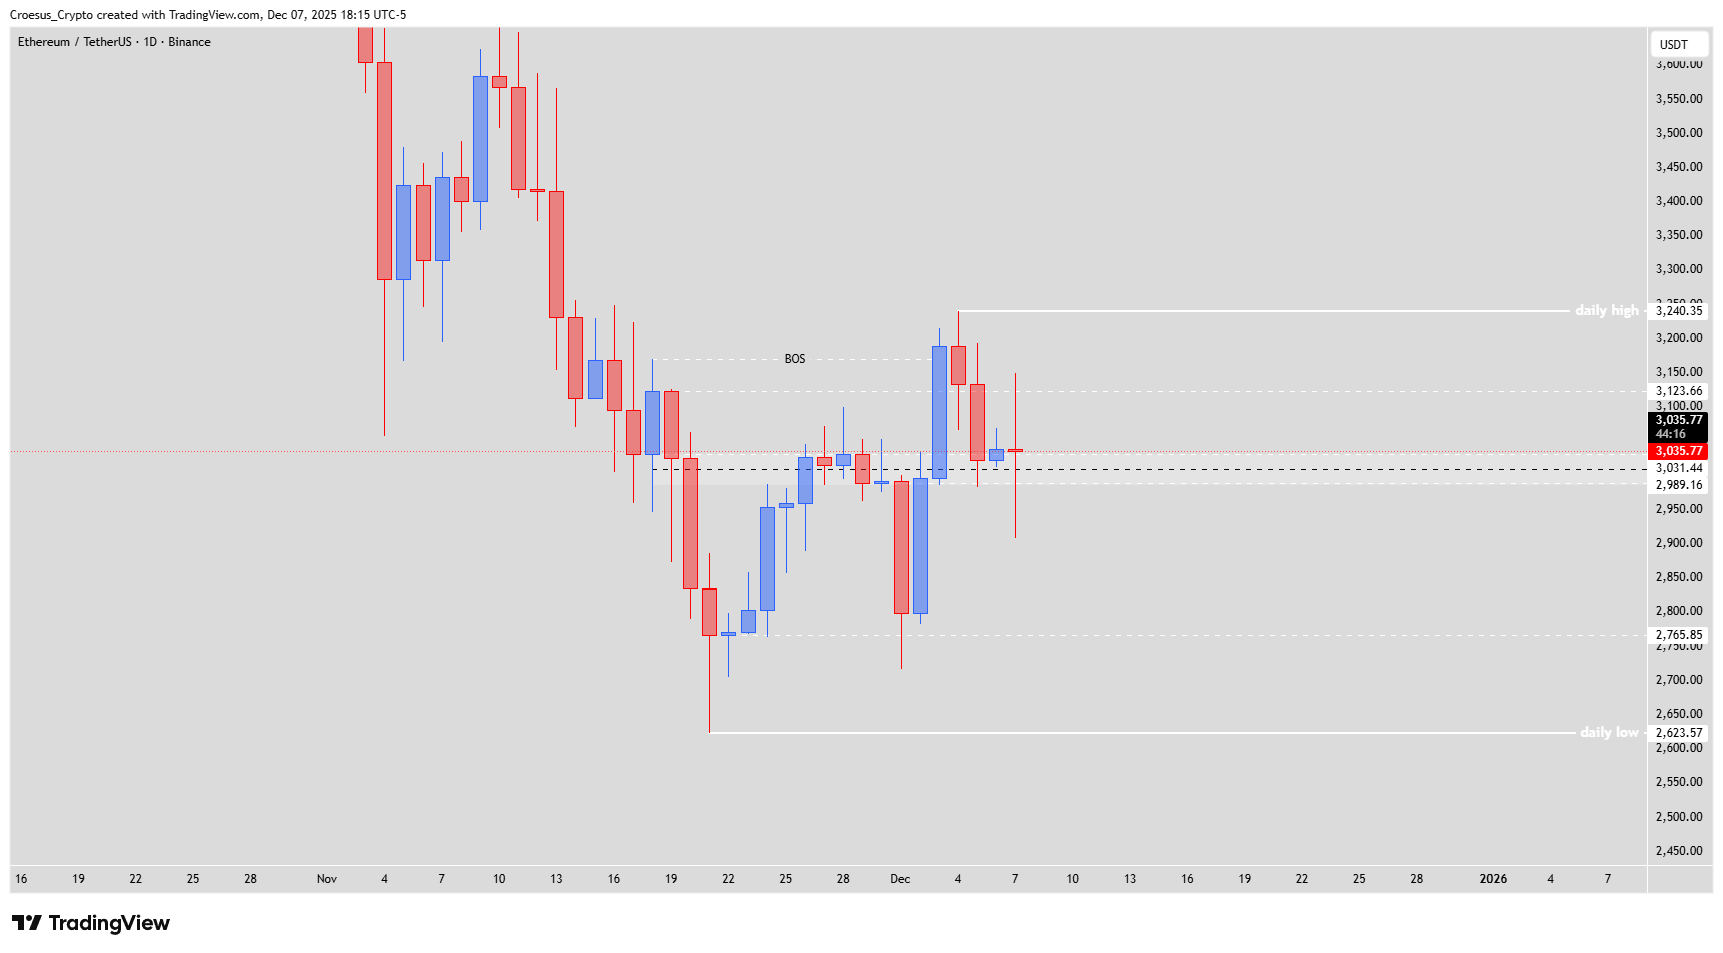
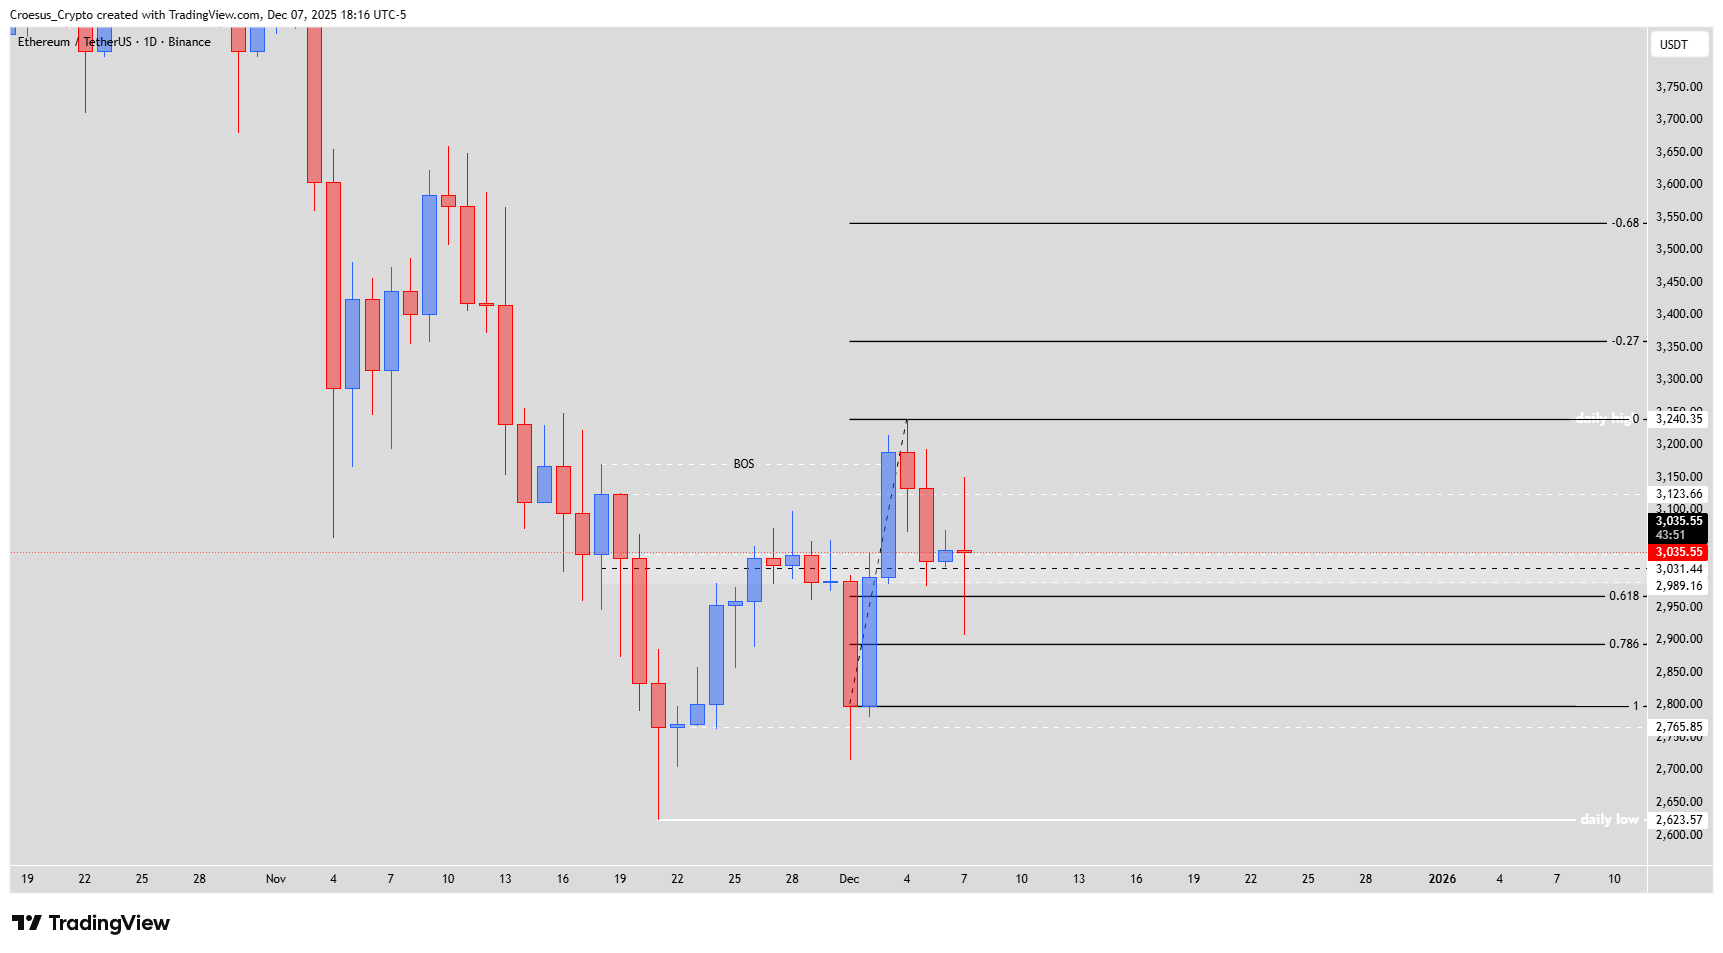
Daily chart ETHUSDT – price rotating between fib 0,618 at $2.989,16 and first structure near $3.123,66
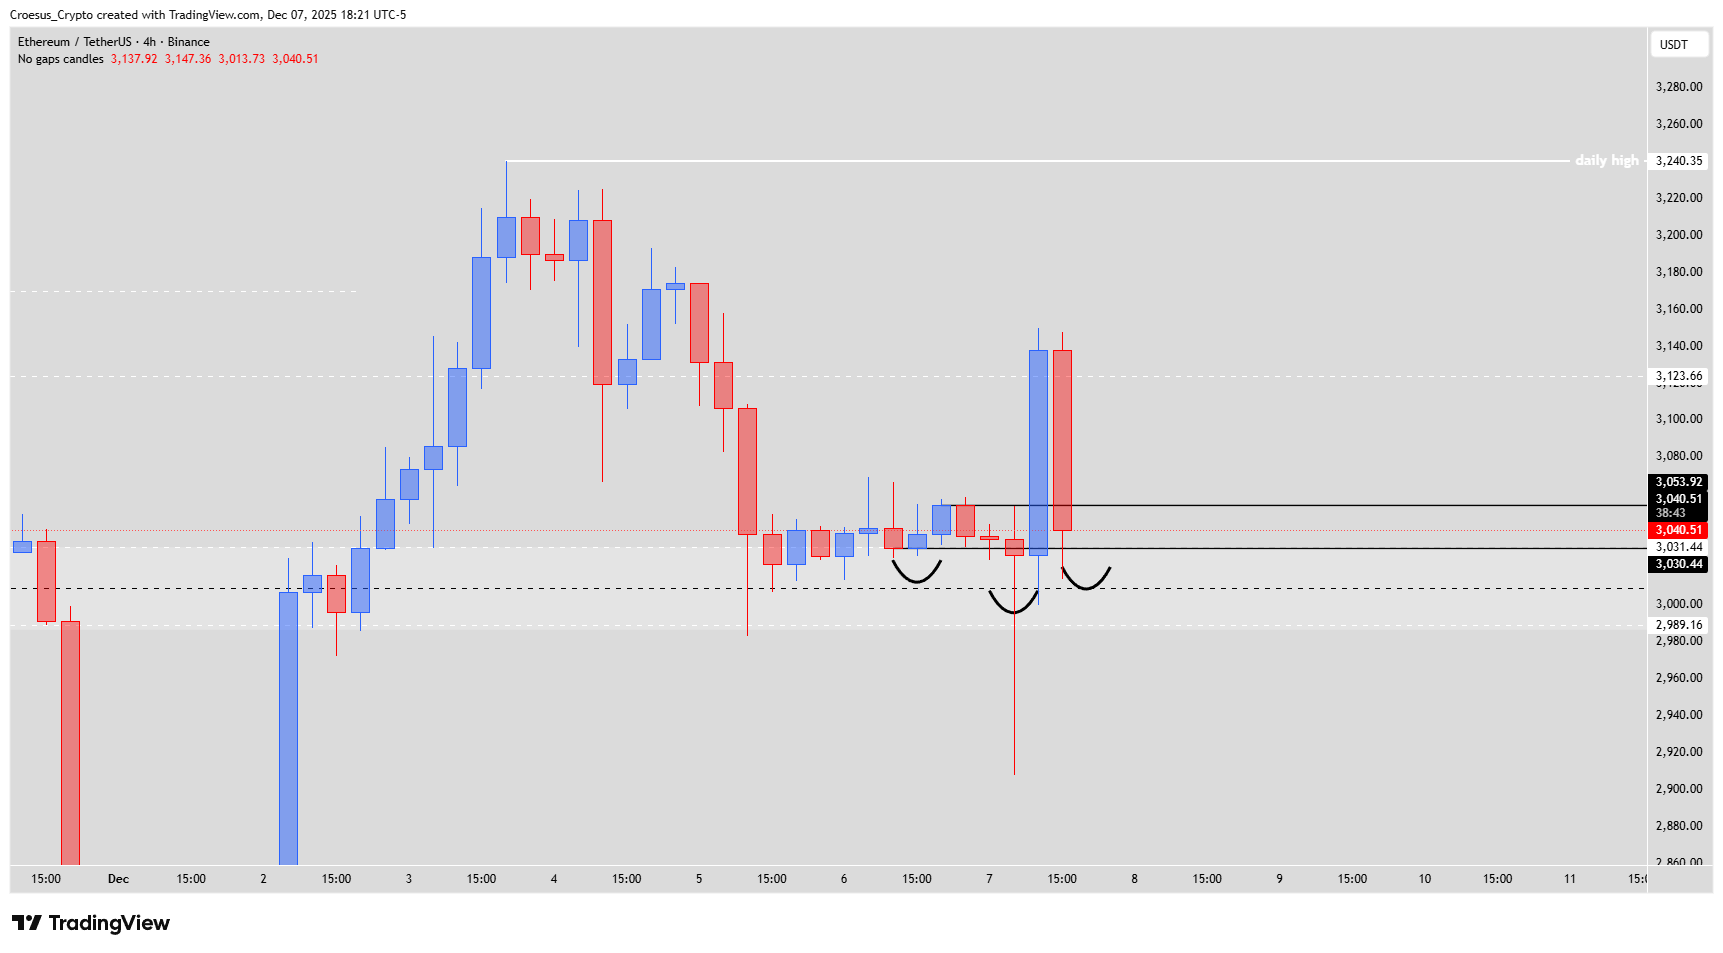
4H chart ETHUSDT – potential inverse head and shoulders around $3.000,00 after liquidity sweep
Trend = bullish ↑
Technical Analysis Key Points
- Yesterday the price was relatively neutral, a common phenomenom this bullrun during the weekends. Retail seems to have lost interest in crypto or doesn't have enough power to move the markets anymore.
- Today we saw an indecisive candle with liquidity sweeps first on the bottom followed by a liquidity sweep of the shorts. And a strong bearish correction. Liquidating a lot of retail traders.
- We can see a potential formation of a 4H inverse H&S. If this candle respects the shoulderlevel, we could take a long trade with thight risk- and money management.
- Bullish set-up : switch of momentum + respecting the level $2.959,36 as shoulder level, showing us the formation of a inverse head and shoulders pattern.
Market Structure Analysis
Daily timeframe
The strong leg down from the higher zone above $3.500,00 was followed by a bounce that created a clear break of structure (BOS) when price closed above a prior lower high.
After this BOS, ETH pushed into the retracement zone of the last bearish leg. The fib 0,618 sits around $2.989,16, the 0,786 just below $2.900,00 and the fib 1 level at $2.765,85.
Current price trades slightly above the 0,618 at about $3.035,00, and below the first structure and resistance band between $3.100,00 and $3.123,66.
The daily high at $3.240,35 has not been broken. As long as this level caps price, the market trades inside a corrective range within a still fragile early bullish attempt after a long down move.
4H timeframe
On the 4H chart, today started with a sweep of the lows below $3.000,00, including a sharp wick that tested below the short term range, then an impulsive bullish move back above $3.030,00, and finally a strong bearish candle that erased much of the bounce.
These moves form the outline of an inverse head and shoulders:
Left shoulder around $3.031,44
Head created by the deeper liquidity grab below $3.000,00
Right shoulder now forming again around $3.000,00–$3.031,44
The neckline of this pattern is around the local 4H resistance near $3.053,92.
Until the neckline is broken and the daily high is challenged, the pattern is only potential, not confirmed. The equal strength of bullish and bearish impulses today highlights that neither side has full control yet.
Key Levels and Scenarios
Key levels
Daily high resistance: $3.240,35
First structure and resistance band: $3.100,00–$3.123,66
4H neckline and local resistance: $3.053,92
Current intraday pivot area: $3.030,00–$3.040,00
4H shoulder and IC zone: roughly $3.000,00–$3.031,44
Fib 0,618 and key support: $2.989,16
Deeper support zone: $2.900,00–$2.850,00
Fib 1 and prior base: $2.765,85
Major daily low: $2.623,57
Bullish scenario
The 4H candle closes above the shoulder zone, holding $3.000,00–$3.031,44 as support and confirming that the liquidity sweep below was mainly a stop hunt.
Price then builds higher lows on 4H above $3.000,00 and breaks through the neckline around $3.053,92 with a onvincing impulsive candle.
After a successful retest of the neckline as support, ETH can target the first structure band at $3.100,00–$3.123,66.
A daily close above $3.123,66 would open the way for a test of the daily high at $3.240,35 and, if momentum persists, the higher fib extensions on the chart.
Bearish scenario
The shoulder level fails and 4H candles close back below $3.000,00 and the fib 0,618 at $2.989,16 without quick recovery.
In that case, the inverse head and shoulders idea weakens and the move today looks more like continuation of the prior selling rather than a reversal attempt.
Price could then drift towards the lower support band between $2.900,00 and $2.850,00. A stronger wave of selling can push ETH back to the fib 1 level around $2.765,85.
If this support fails as well, the market may revisit the broader daily low near $2.623,57, which would fully negate the current bullish attempt.
Trading Implications
For traders looking for long setups
The more attractive long entries appear if ETH clearly respects the shoulder zone at $3.000,00–$3.031,44, shows rejection wicks and strong 4H closes back above $3.040,00, and then breaks the neckline at $3.053,92.
Any longs taken directly from the IC and shoulder band should use tight risk and money management, since the daily high is still unbroken and strong bearish candles still appear after liquidity sweeps.
For traders looking for short setups
Failed attempts to hold above $3.053,92 or repeated rejections from $3.100,00–$3.123,66 provide tactical short opportunities as long as invalidation is kept just above the rejected zone.
A clean close below $2.989,16 that turns the area into resistance would further support a move towards $2.900,00–$2.850,00 or even $2.765,85.
For traders waiting for more clarity
With a potential reversal pattern on 4H but no confirmed break of daily resistance, the market is in a decision zone.
Waiting for either a confirmed 4H and daily break above $3.053,92 and then $3.123,66, or a confirmed loss of $3.000,00 and $2.989,16, can reduce the risk of getting trapped in the current back and forth volatility.
This content is for educational purposes only and is not financial advice or a recommendation to buy or sell any asset.