

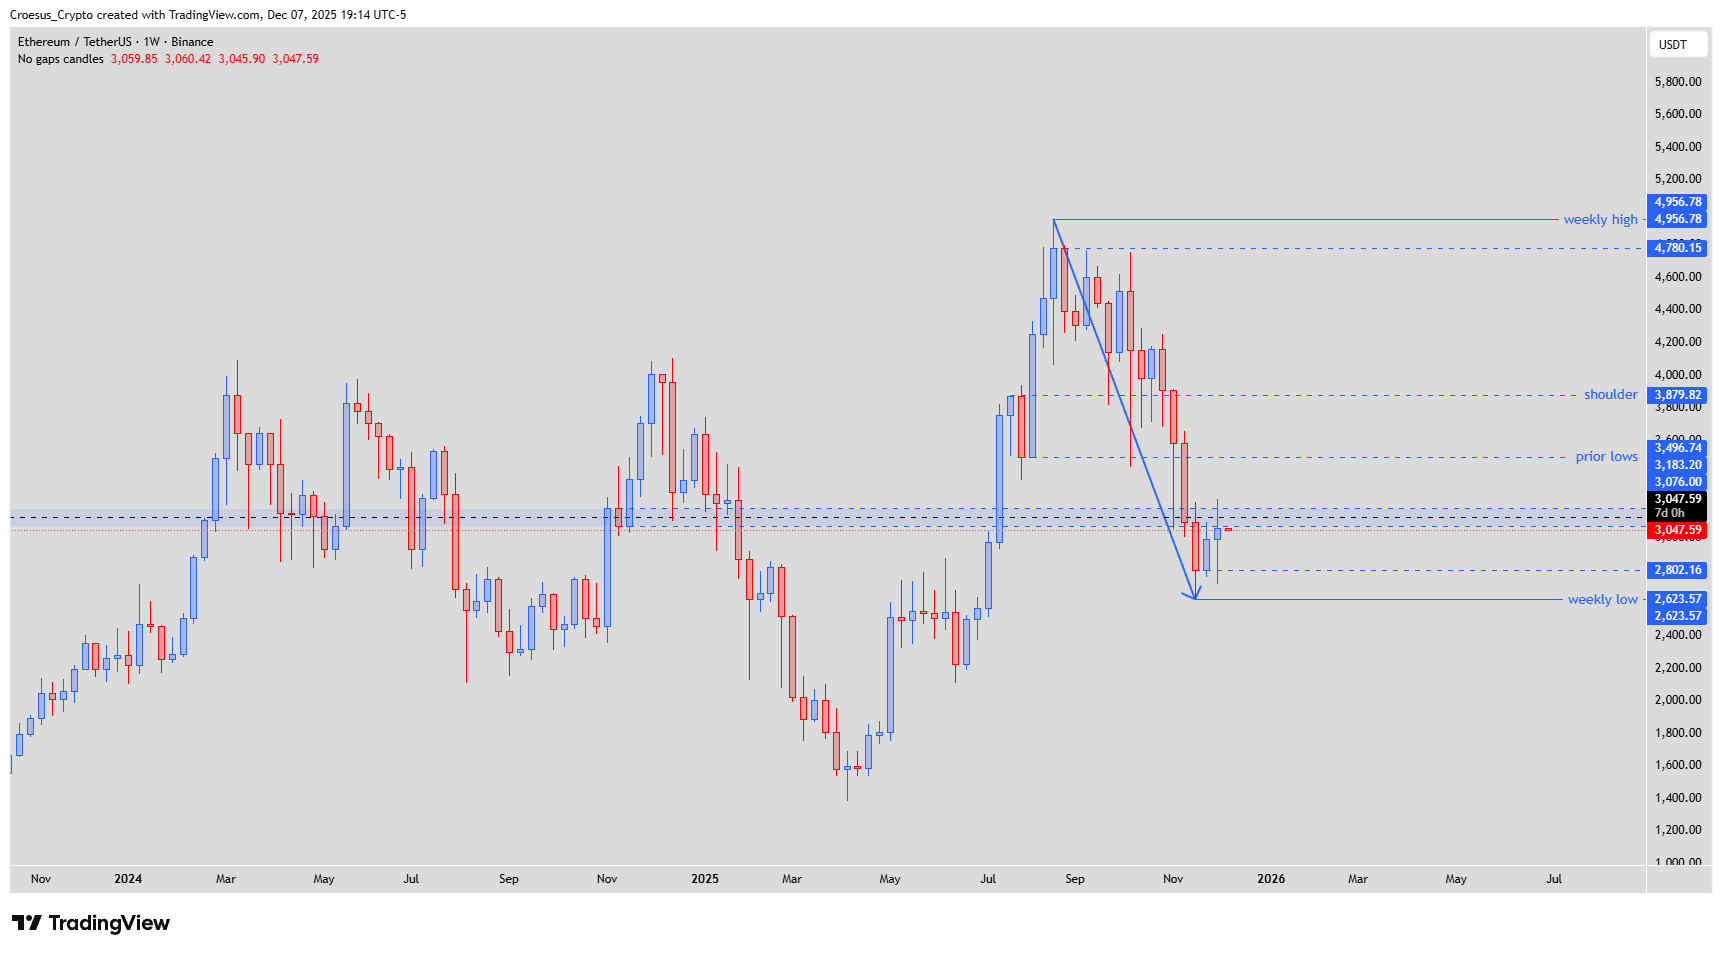
The weekly ETH chart shows a strong downward impulse followed by the first signs of buying interest from the $2.600,00 region. However, the bounce is capped under a horizontal decision zone around $3.076,00 that previously acted as a key level for both buyers and sellers. This zone now acts as resistance. The question for the coming weeks is whether ETH can reclaim that area and open a corrective leg higher, or if the market rolls over again toward the weekly low.
Weekly chart ETHUSDT – bearish impulse into weekly low $2.623,57 with price capped below decision zone starting at $3.076,00
Technical Analysis Key Points
- After a bullish candle, we saw the price sweeping first the lows and next the lows.
- But the price was stuck below a decisive buy & sell area, acting as a resistance, with the low of the zone situated at $3.076,00.
- As much as we want the price to surge back to the prior lows or even the shoulderlevel, we need to see this zone being reclaimed. Breaking and retesting this zone could initiate a bullish move.
Market Structure Analysis
The dominant weekly structure is a clear bearish leg from the region near the weekly high at about $4.956,78 down to the weekly low around $2.623,57.
From that weekly low ETH printed a first bullish weekly candle, signalling that sellers took some profit and that buyers were willing to step in at this extreme.
The following price action swept the lows of that first bounce, grabbing liquidity around the $2.800,00–$2.900,00 area, but failed to push through and close below the higher time frame weekly low.
Price then moved back up into a decision area that has acted as an important buy and sell zone in the past. The lower boundary of that zone is at $3.076,00, with the upper part connecting into the prior lows around $3.183,20–$3.496,74.
For now, this zone acts as resistance. Weekly candles show that buyers are active from below but have not yet been able to reclaim this level.
Above this consolidation, the next structural references are the prior lows and then the shoulder level around $3.879,82, followed by the weekly high region at $4.780,15–$4.956,78.
Key Levels and Scenarios
Key levels
Weekly high region: $4.780,15–$4.956,78
Weekly shoulder level: about $3.879,82
Prior lows and resistance band: roughly $3.183,20–$3.496,74
Decision zone low / main resistance: $3.076,00
Current mid range area: around $3.000,00
Intermediate support: $2.802,16
Weekly low and main support: $2.623,57
Bullish scenario
ETH holds above the intermediate supports between $2.623,57 and $2.802,16 and stops making new weekly lows.
Buyers push price through the decision zone low at $3.076,00 with a strong weekly close, followed by a retest of this level that holds as support.
Once $3.076,00 is reclaimed in this way, the door opens for a corrective move toward the prior lows band at $3.183,20–$3.496,74.
If momentum continues and ETH closes weeks above that band, the next upside reference is the shoulder level around $3.879,82. A later reclaim of that shoulder would bring the weekly high zone back into play.
Bearish scenario
ETH remains capped below $3.076,00 and weekly candles continue to show rejection from this decision zone.
A failure to make higher lows and a weekly close back below $2.802,16 would show that the bounce is losing strength.
Further selling pressure could then push price once more to the weekly low around $2.623,57.
A decisive weekly close below $2.623,57, followed by a failed attempt to reclaim it as support, would confirm continuation of the broader bearish trend and could start a new leg down toward lower untested demand zones that are not yet visible on this chart.
Trading Implications
For traders considering long positions
Longs remain counter trend on the weekly chart. Reduced risk makes more sense until ETH reclaims $3.076,00 with a weekly close and a successful retest.
Aggressive long entries from the $2.623,57–$2.802,16 region should have tight invalidation below the weekly low and modest position size, as any failure there may lead to a fresh expansion down.
For traders considering short positions
As long as price fails to break and hold above $3.076,00, this decision zone can serve as an area to look for trend following shorts with invalidation just above the zone.
If ETH closes a week back below $2.802,16 and starts to accelerate downward, this would confirm that the corrective bounce is likely over and that downside continuation toward $2.623,57 or lower is in play.
For patient swing traders
Waiting for either a confirmed reclaim and retest of $3.076,00 for a more confident long bias, or a clear breakdown below $2.623,57 for a more confident short bias, can help avoid being chopped in this early corrective phase.
This analysis is not financial advice; always do your own research and manage your risk before trading.