

ETH Marketcap / Ethereum
ETH quarterly analysis Q1 2026. Ethereum is in a bullish context but currently trades inside a corrective phase, where the market is testing whether the larger reversal structure can stay intact while price rotates within a wide multi-month range.
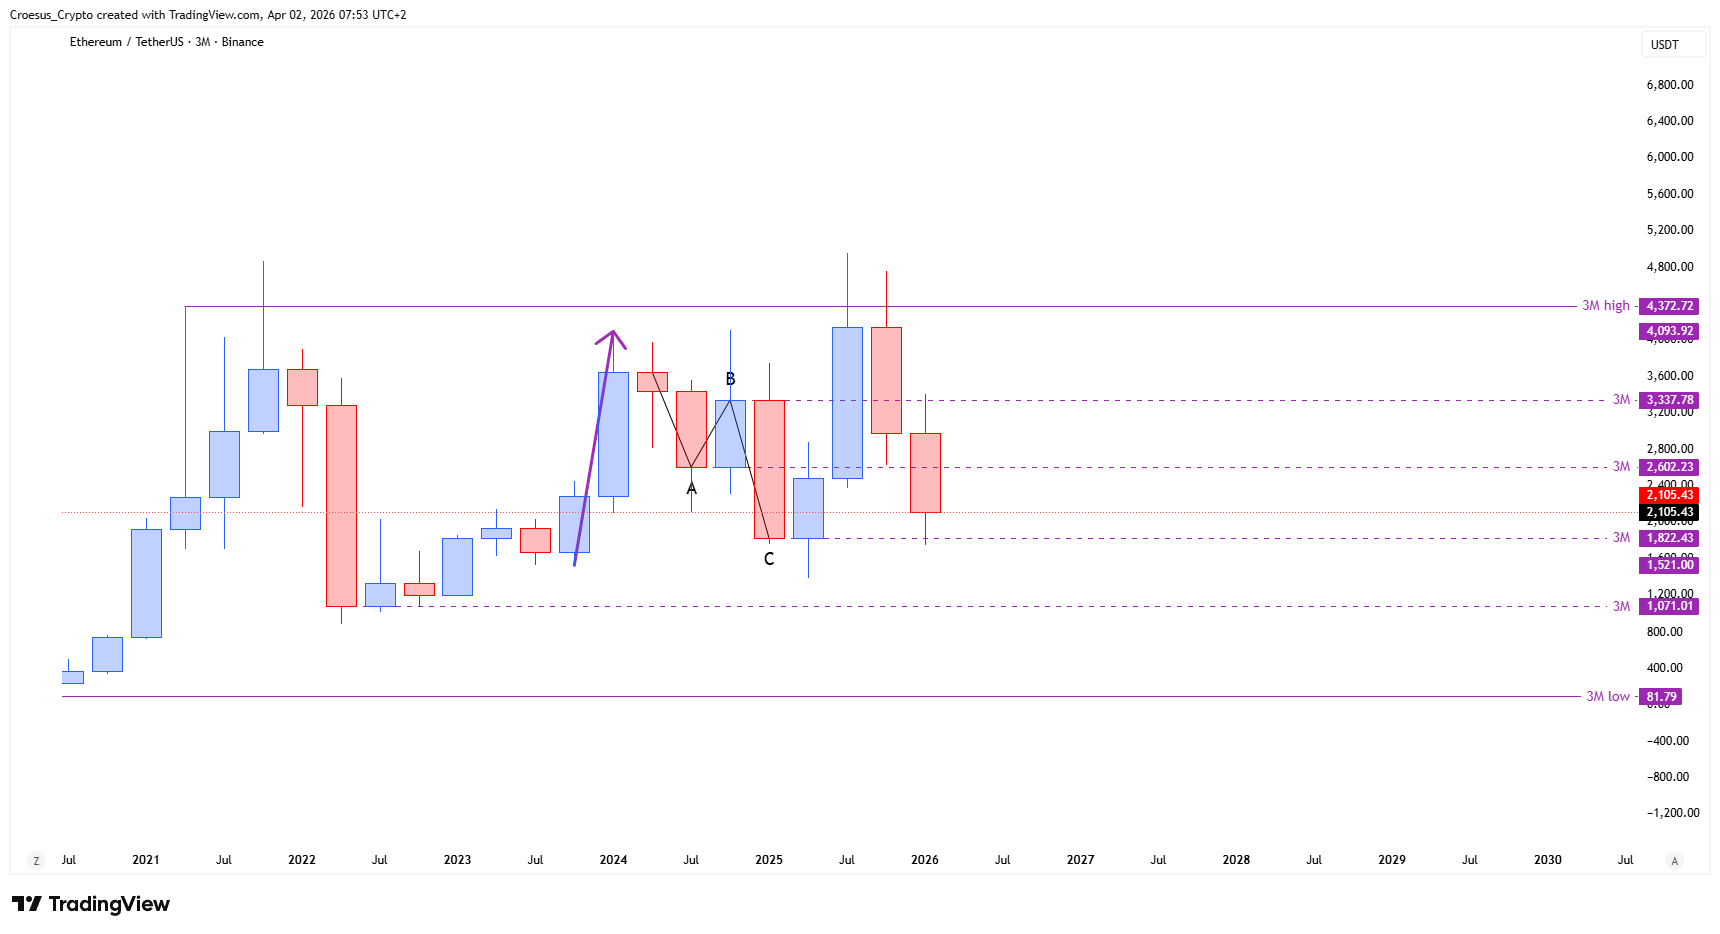
- ETH price is showing us the retest of the head of the larger inverse head and shoulders pattern.
- The 3M range on ETH is very large, as we failed to break the prior high during the last bullrun.
- But when we look fractally, we see a bullish impulse (purple arrow up), followed by an ABC correction. This ABC-correction gives us the base for an inverse head and shoulders pattern. The A is the shoulderlevel, the B is the neckline and the C is our head. After printing our head we saw a retest of the shoulderlevel but then price moved up to the range high without retesting the shoulderlevel. This means that we still had the shoulderlevel at least to be retested. But we saw a retest to the head printing a double bottom at this moment.
- For the pattern to stay valid bulls need to defend the head level @ 1822.43 $. Can we move lower ? Yes, price can go everywhere in the next 3 months, but needs to close above that level to maintain a valid pattern.
Market Structure Analysis
From a naked trading perspective, this ETH daily analysis is defined by a larger inverse head and shoulders attempt developing inside a broad 3-month range.
The fractal read (impulse up, then ABC correction) frames the correction as structural rather than a trend break, with the “C” leg forming the head. The key nuance is that price previously rotated up to the range high without fully re-visiting the shoulder level, leaving unfinished business on the downside while still keeping a bullish reversal narrative alive.
The current retest of the head, combined with a double bottom, is the market’s decision area: either buyers hold the head support and rebuild an impulsive leg, or the structure degrades into a deeper corrective swing.
Key Levels and Scenarios
Bullish continuation depends on acceptance above the head support and a constructive rotation back toward the upper boundary of the range. A bearish extension remains possible within PHASE 1, but the inverse head and shoulders framework requires the market to defend the head on a closing basis to keep the setup valid.
- $1822.43 head level - key structural support; needs to hold on a close to maintain a valid pattern
- Neckline area (B) - upside trigger zone for reclaim strength, if price rotates back up
- Shoulderlevel (A) - downside retest area that remains structurally relevant due to prior missed retest
- 3M range high / prior high zone - major resistance cap until a clean break and acceptance occurs
Trading Implications
In this ETH daily analysis, risk is concentrated around the head retest: aggressive positioning typically focuses on confirmation of support holding, while conservative execution waits for a clearer break of structure and acceptance back above resistance zones. Until then, our bias stays bullish-but-corrective, with support resistance levels driving the next directional expansion.
This analysis is for informational purposes only and does not constitute financial advice.