

In this Ethereum quarterly analysis (3M) and yearly analysis, we focus on how the 2025 yearly close shaped a larger indecision candle while the 3M structure builds a potential inverse head and shoulders after an ABC correction of the previous bullish impulse.
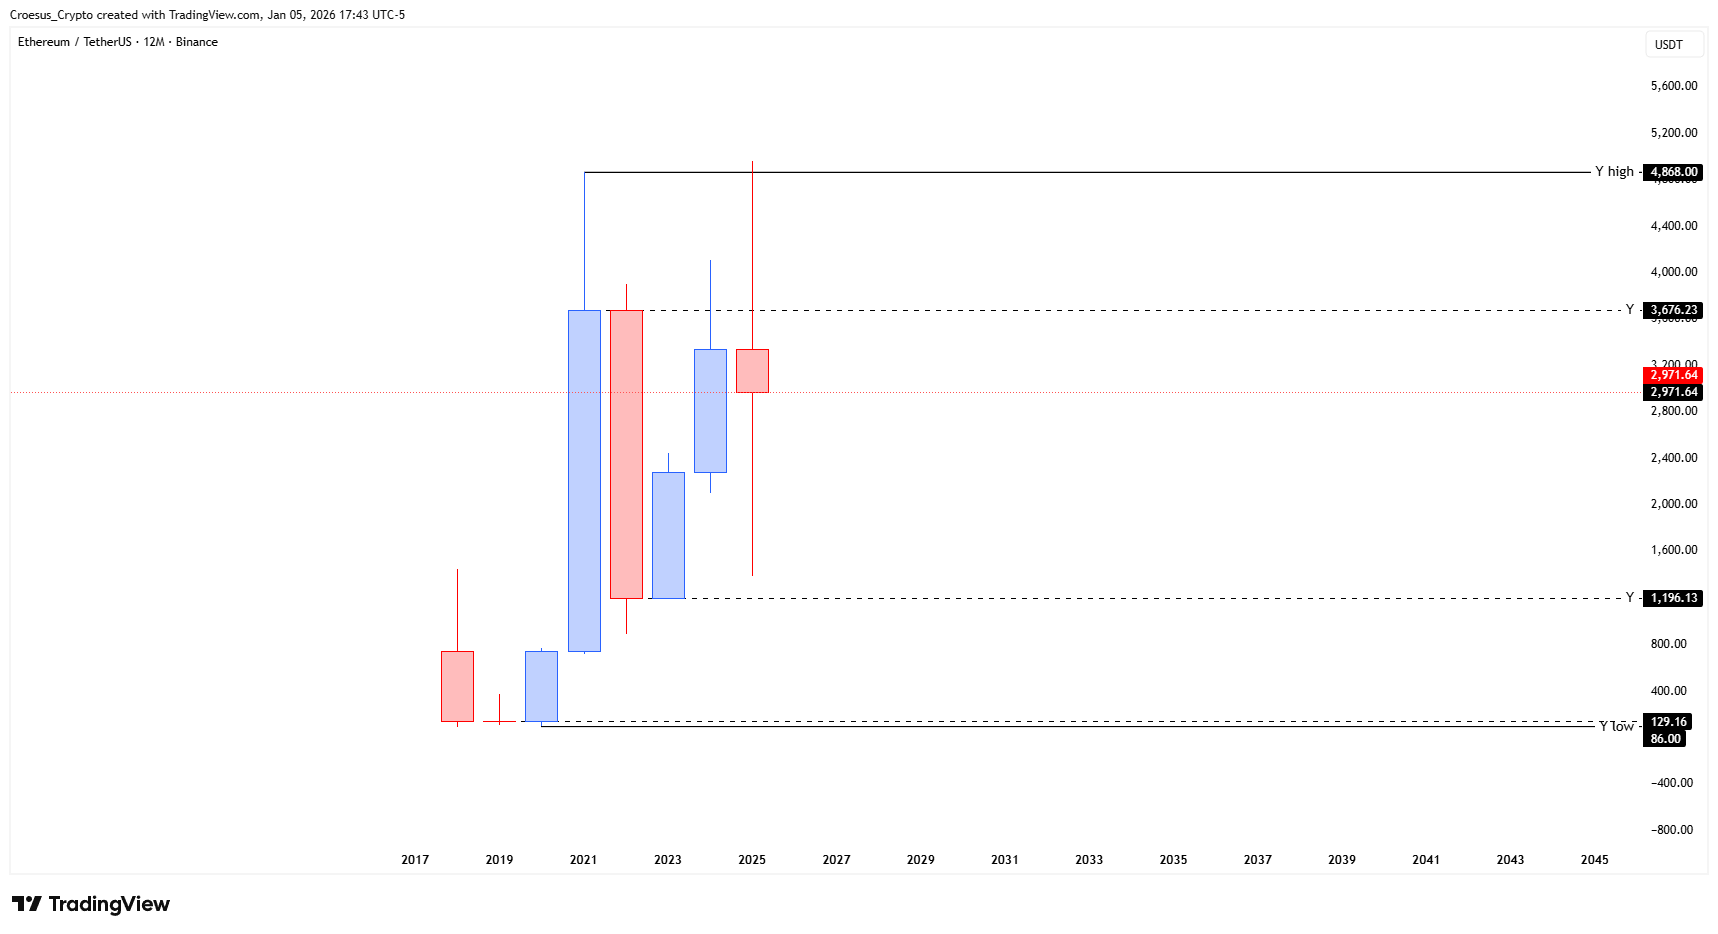
Ethereum yearly chart January 2026 with failed break above yearly high, indecision candle and yearly low near $1,196.13.
Technical Analysis Key Points
- As we have a yearly close, we are also looking at the yearly chart.
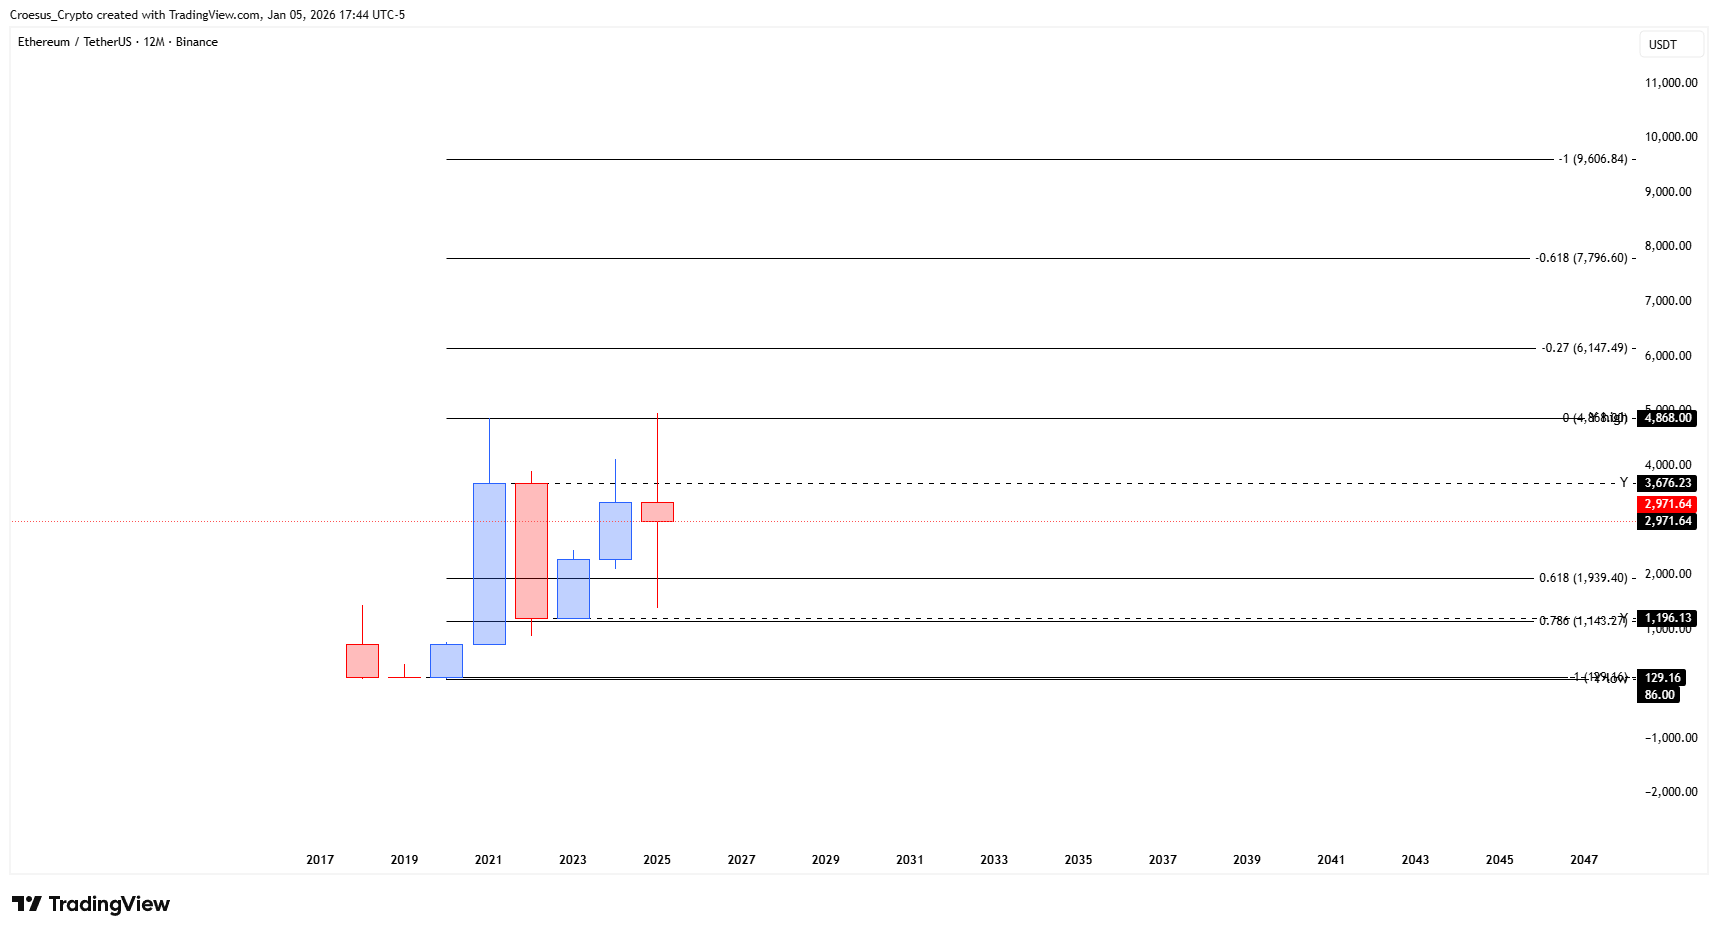
- We can see that mid 2025 we broke the Y high (new action) but never could close above it. The price fell down below the Y opening price, creating a clear indecision candle (eventhough still bearish). Could we revisit the lows at $1.196,13 ? Or are we going to fill up the impulsive test of the Y high and are we going to see a structural retest ?
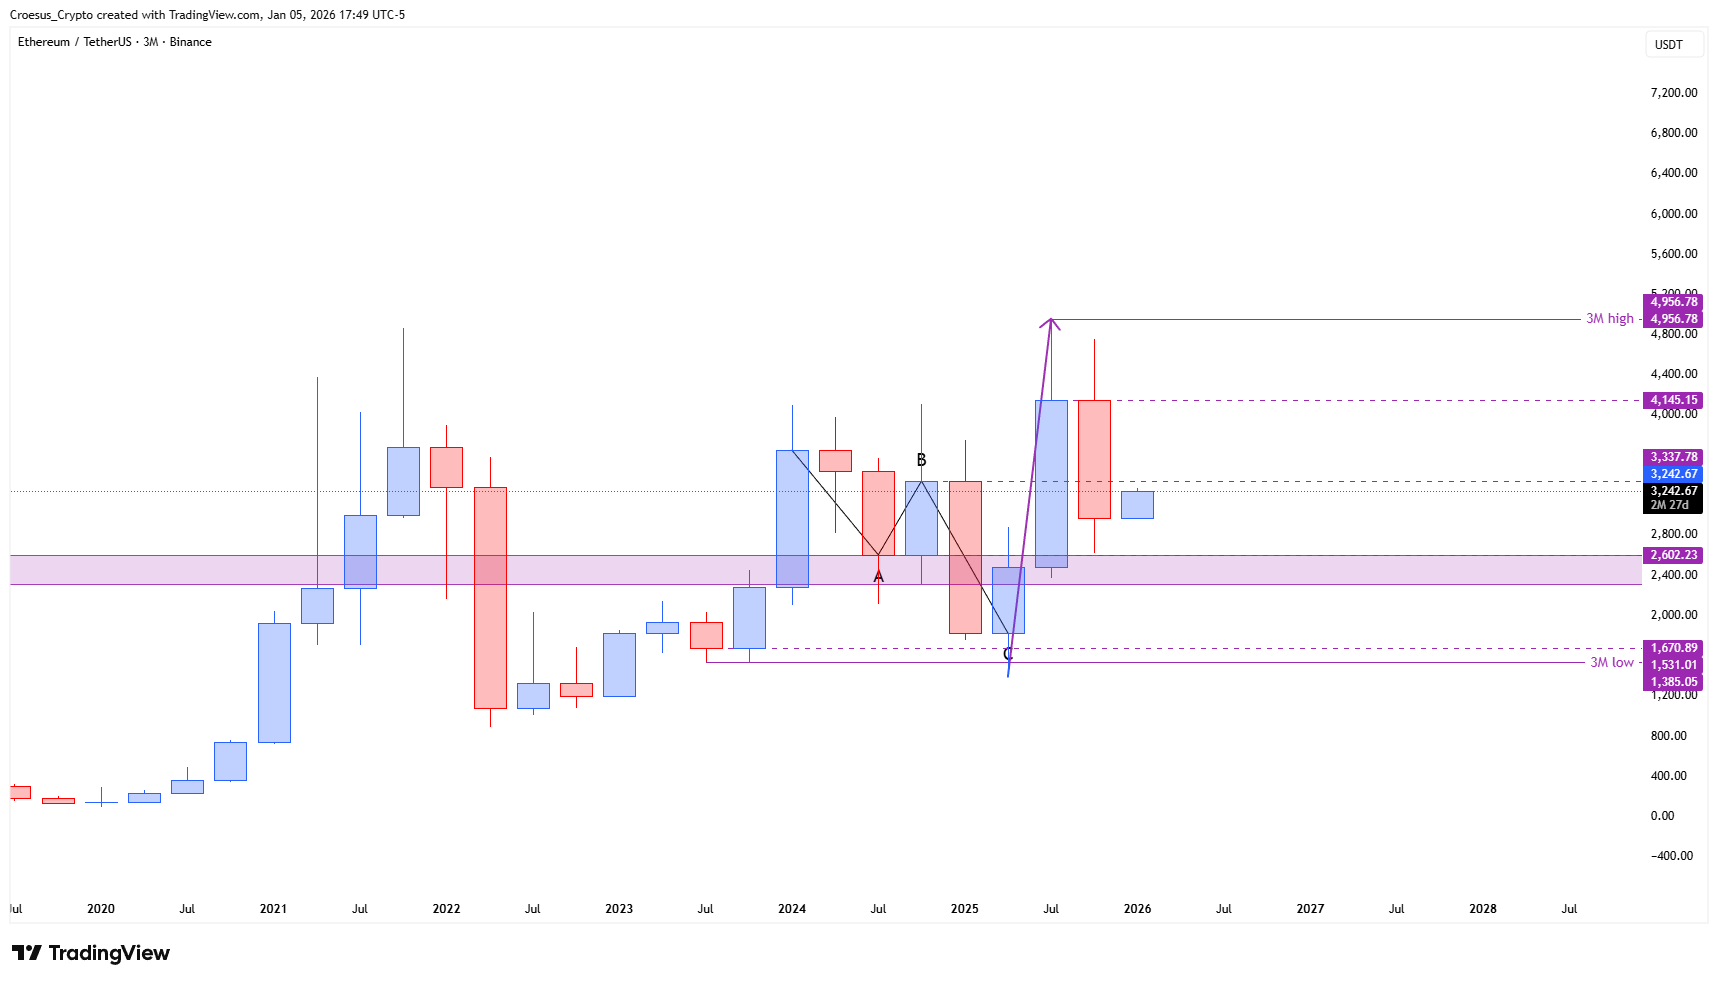
- if we zoom in on the 3M chart, we can see that we had an ABC correction of the previous bullish impuls, creating the start of an inverse H&S pattern. A being the shoulder level, B being the neckline and C being the head.
- After the breakout through the B-level (neckline), an attempt to retest the shoulderlevel (A) followed. But we just did not touch it. We would to see it confirmed as support before going higher.
Market Structure Analysis
On the yearly timeframe, Ethereum’s technical analysis shows that mid-2025 price broke above the yearly high but failed to close there, leaving a large upper wick and an overall bearish-leaning indecision candle. That failure above the yearly high suggests unfinished business: either a deeper revisit toward the yearly low around $1,196.13 or a later structural retest of the yearly high zone after the current consolidation phase.
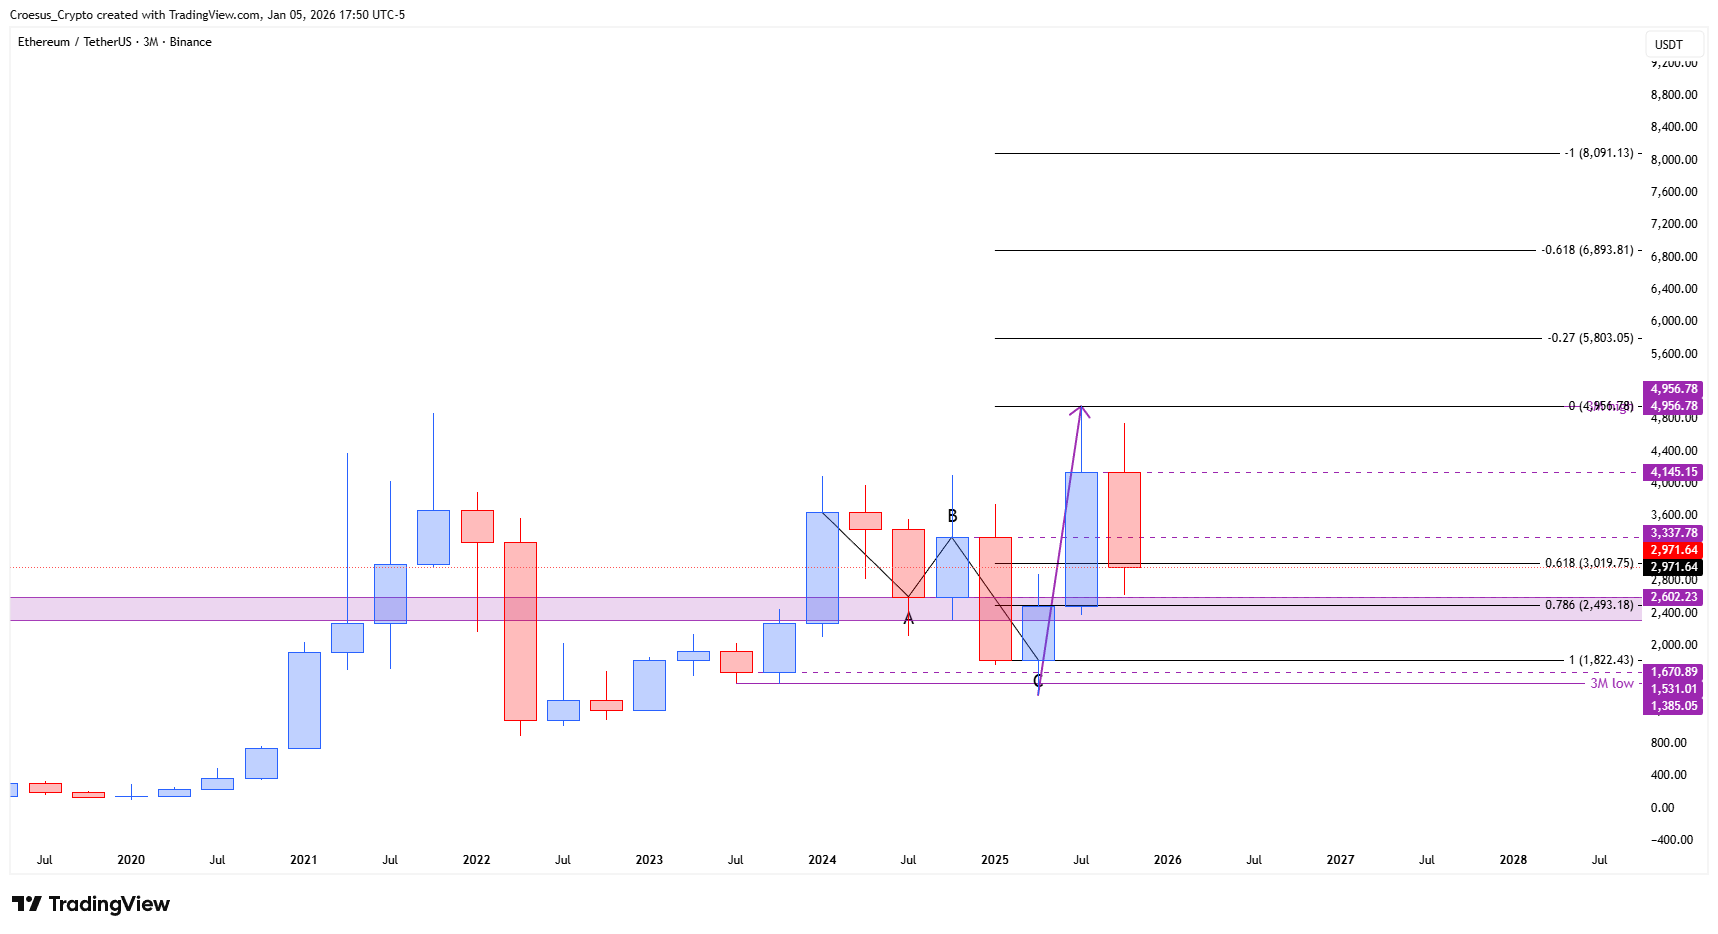
Drilling into the Ethereum 3M analysis, the quarterly chart reveals a clear ABC corrective move against the prior bullish impulse. This correction defines an emerging inverse head and shoulders: point A is the left shoulder in the main demand band, B is the neckline resistance, and C marks the lower head. After breaking above neckline B, price attempted to rotate back into the shoulder area (A) but stopped just short, leaving that zone untested as clean support.
As long as quarterly closes hold above the head low (C) and price continues to respect the broader support resistance band around the shoulder region, the pattern favours eventual continuation higher. A confirmed retest of A as support would strongly validate the inverse H&S structure and open room for a renewed move toward the yearly high, supported by the broader Fibonacci rhythm of the prior uptrend.
Key Levels and Scenarios
Bullish scenario:
If Ethereum consolidates above the emergent shoulder support (A) and we finally see a clean retest that holds, our Ethereum 3M analysis anticipates a push back toward neckline B and potentially a full retest or marginal breakout of the yearly high. That would frame the ABC move as a completed corrective phase within a larger bullish cycle.
Key levels to watch:
Yearly high zone: Major resistance; failure here again would keep the yearly indecision structure in play.
Neckline B area: Current pivot resistance on the quarterly chart; sustained closes above would confirm the inverse H&S breakout.
Shoulder zone A: Key support; a successful retest turns this into a high-probability re-entry area for trend traders.
Head low C: Structural invalidation level for the inverse H&S; a break below would negate the bullish pattern.
Yearly low near $1,196.13: Extreme downside reference if macro conditions deteriorate and support zones fail.
Trading Implications
From a trading standpoint, the best risk/reward often sits near the shoulder demand zone with invalidation below C, while conservative participants may prefer to wait for a confirmed quarterly close above neckline B before positioning for a move back toward the yearly high.
This analysis is for educational purposes only and does not constitute financial advice.