

In this Ethereum weekly analysis for week 2 January 2026, we see the same pattern that appeared on TOTAL and BTC: a strong bearish impulsive move down has stalled, and price action now hints at a potential bullish corrective phase. Our technical analysis focuses on how this developing correction interacts with nearby support resistance levels and the higher-timeframe yearly level.
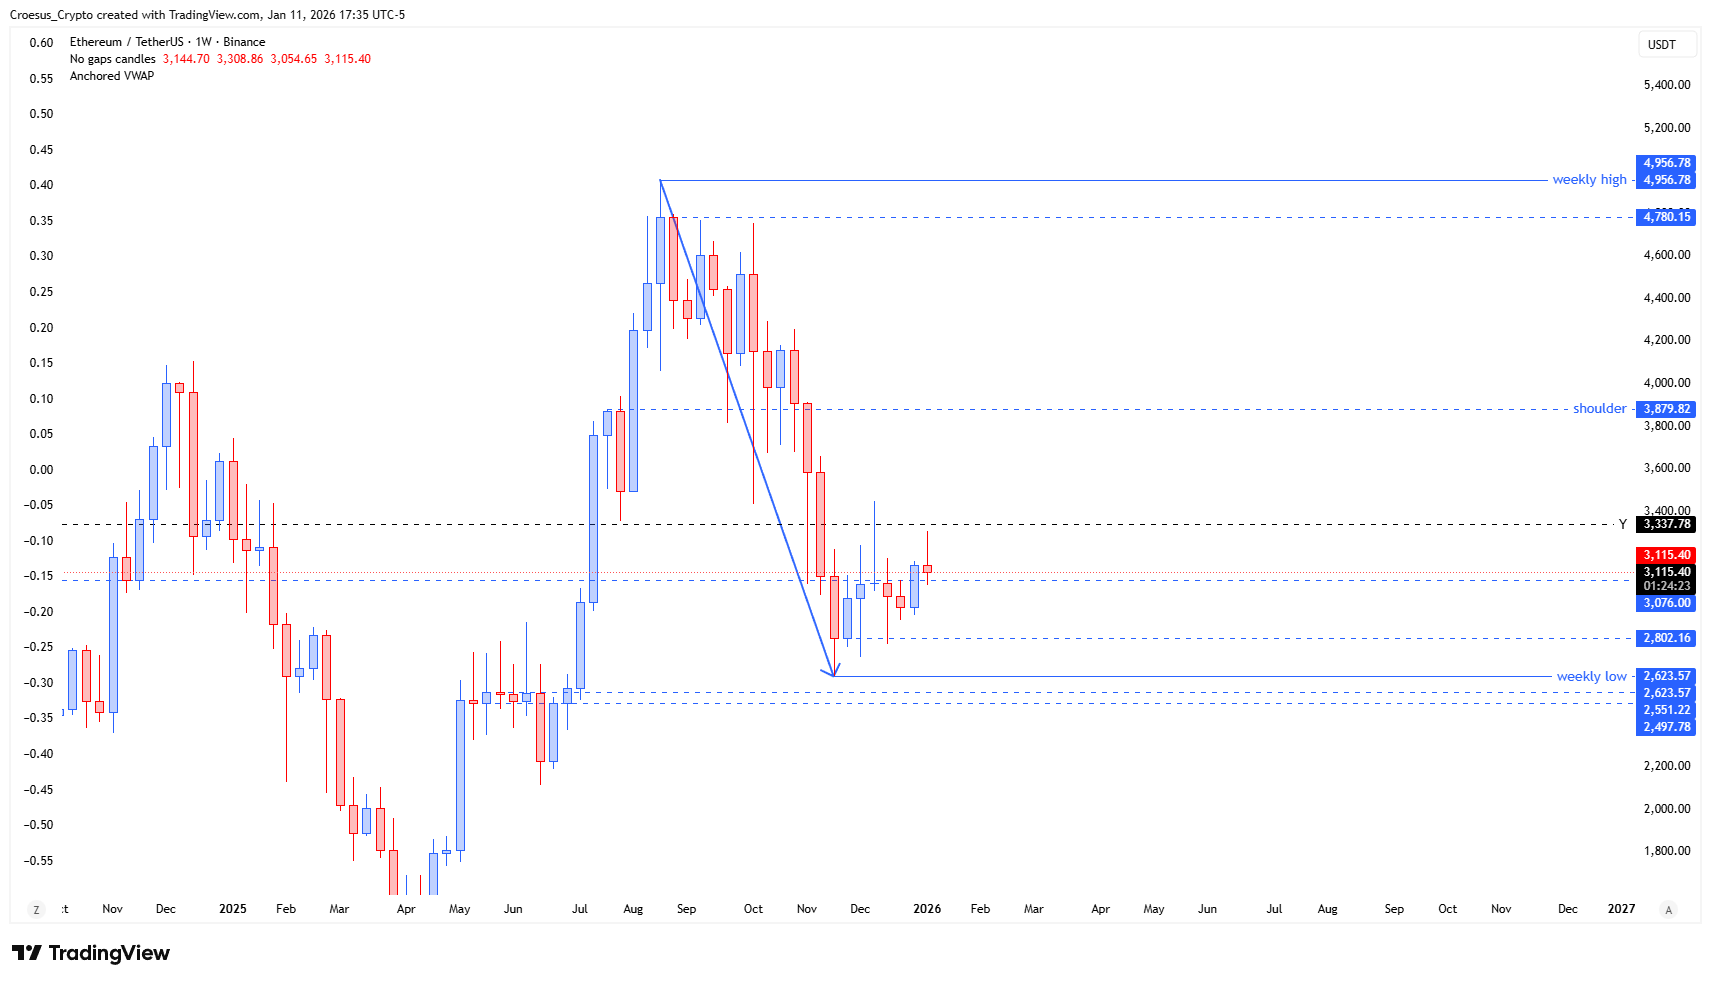
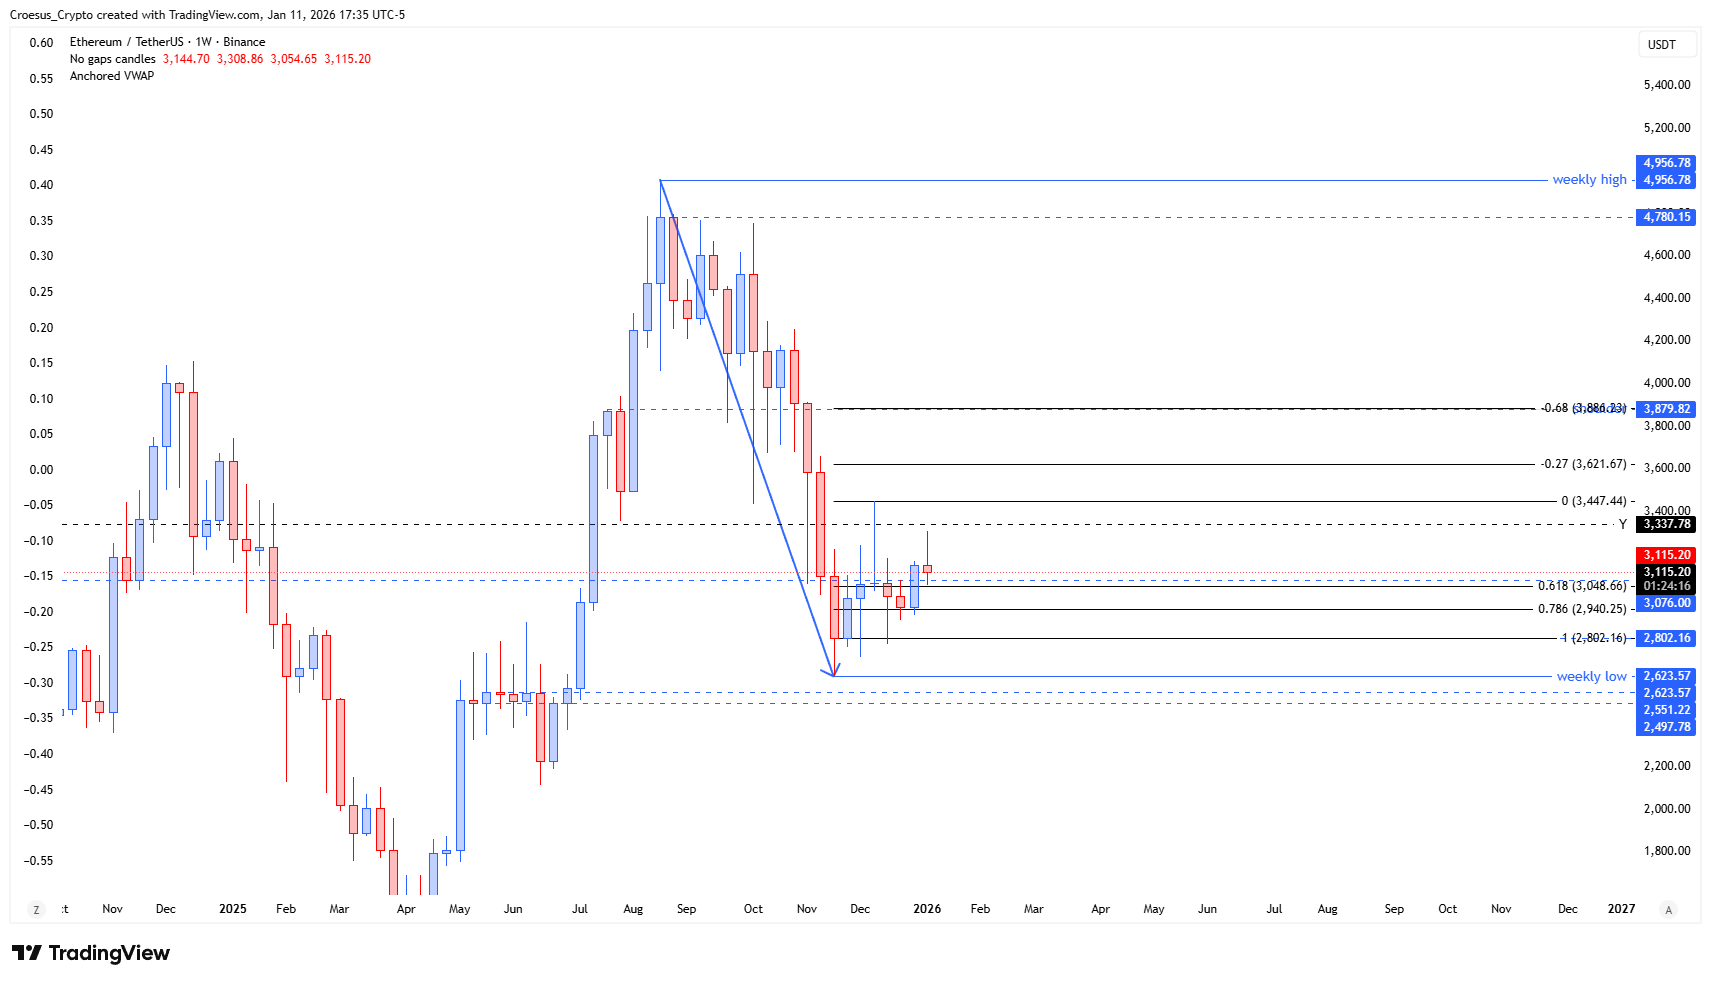
Ethereum weekly chart December 2025 with head and shoulders structure, weekly low and key support resistance levels for ABC correction.
Technical Analysis Key Points
- Just as we saw with TOTAL and BTC, a bearish impulsive move has been stopped and shows us signs of slowing down and possible reversal, possibly starting a bullish corrective move. Most likely towards the shoulder level @$3.879,82
- Price has been hovering between the low @$2.802,16 and a prior low @$3.076,00.
- Last week price broke above this level, to retest it this weekly.
- Major resistance above the price at this moment remains the yearly level @$3.337,78 .
- If we look back at mid-July 2025, we saw price break through this level, to retest this two weeks later. We already retested this level once, so resistance might still be strong at this moment.
- A break and retest of this yearly level, would initiate a move upward towards the shoulderlevel.
- But let's not forget : this current bullish move is still very corrective, The current bullish candle are not as convincing as the bearish candles down we saw in October - November 2025
Market Structure Analysis
The dominant leg on the Ethereum weekly chart remains the sharp sell-off from the $4,700–$4,900 area into the current base around $2,800. Since then, price has been oscillating between the low at $2,802.16 and the prior low at $3,076.00, indicating a slowdown in bearish momentum and the early stages of a corrective structure. Last week’s breakout above $3,076.00 and this week’s successful retest confirm that this former floor is now acting as support.
Overhead, the yearly level at $3,337.78 is the main obstacle. Historically, in mid-July 2025, a clean break and retest of this same level triggered a strong impulsive advance, so we treat it as the key pivot. A sustained move above and successful retest could open the path toward the shoulder level at $3,879.82, where we also see a Fibonacci retracement cluster from the prior bearish impulse. Until that happens, we treat the current rise as a corrective bounce within a broader downtrend.
Key Levels and Scenarios
Bullish scenario:
If Ethereum continues to hold above $3,076.00 and then breaks and retests the yearly level at $3,337.78, we expect a corrective move targeting the $3,700–$3,879.82 shoulder area, roughly a 15–20% move from current prices. Failure back inside the $2,802.16–$3,076.00 range would weaken the bullish case and risk a return toward the weekly low.
Key levels to watch:
$2,802.16 – Weekly low and base of the current structure.
$3,076.00 – Reclaimed support; must hold to maintain the corrective bias.
$3,337.78 – Yearly resistance; break/retest is the trigger for further upside.
$3,879.82 – Shoulder level and major resistance with Fibonacci confluence.
Trading Implications
For traders, the $3,076.00 area can act as a tactical demand zone within a still-bearish macro trend, with invalidation below $2,802.16 and upside targets at $3,337.78 and $3,879.82, while keeping position sizes conservative given the corrective nature of the current move.
This analysis is not financial advice; always do your own research and manage your risk before trading.