

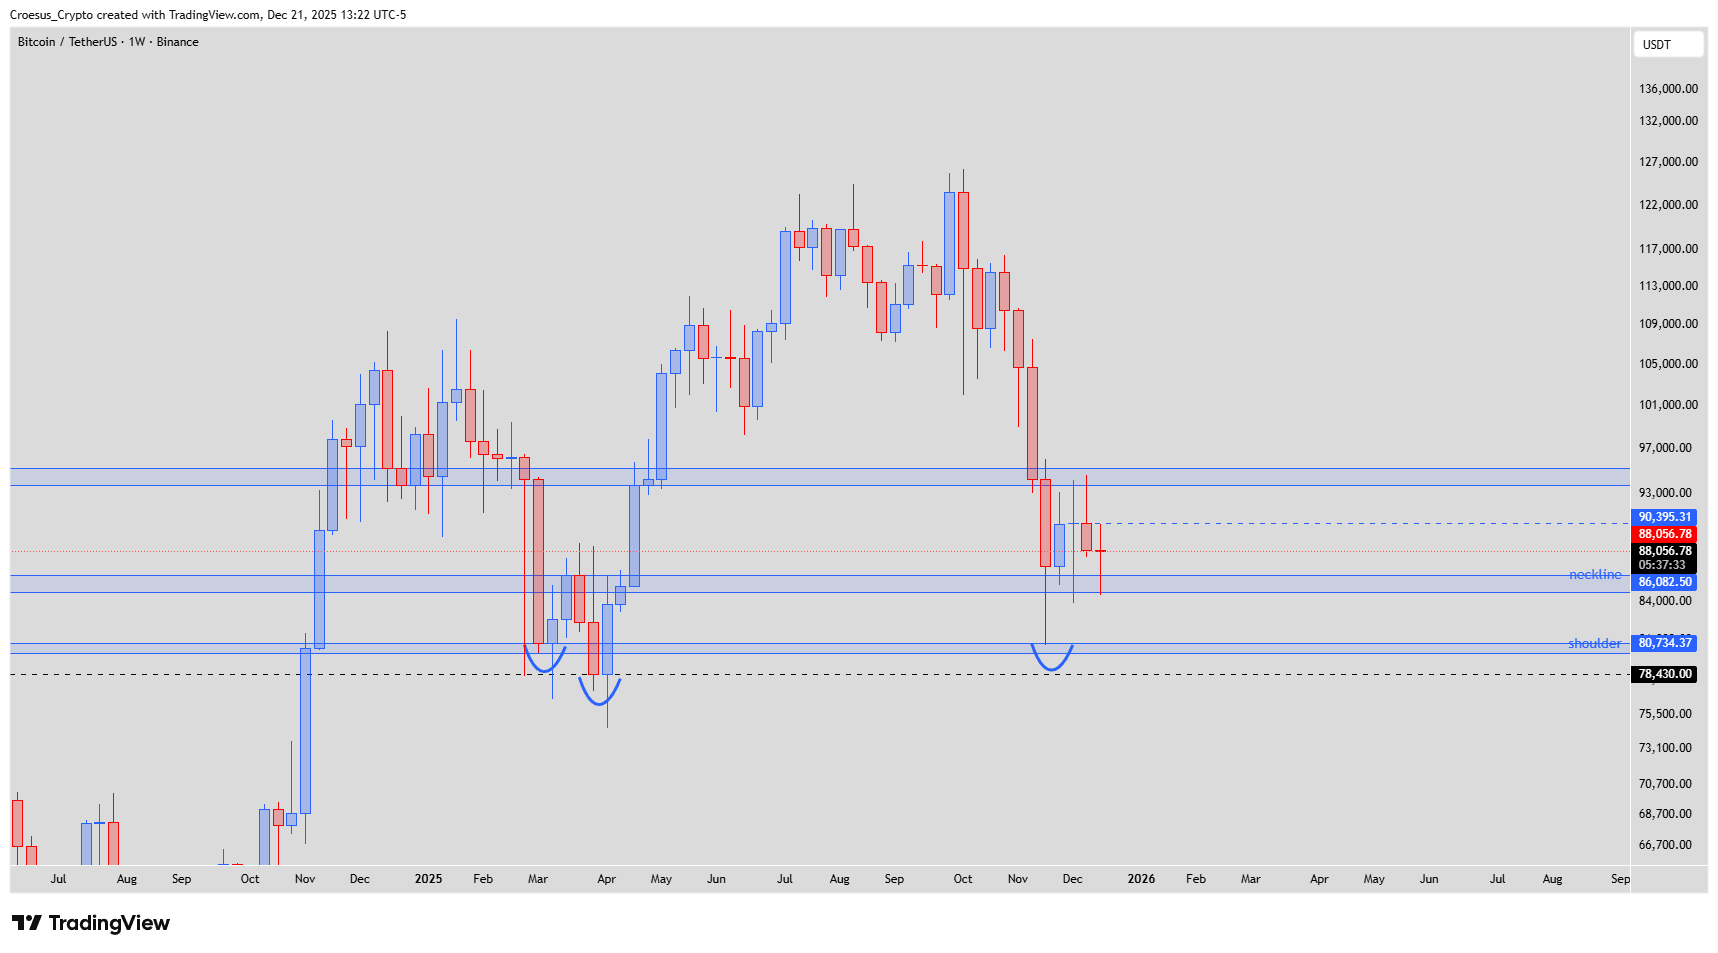
In this Bitcoin weekly analysis for week 51 of 2025, we focus on the sharp November sell-off, the capped rebound into prior lows at $93.738,20 and the current range forming between that resistance and the key shoulder support around $80.734,37. Price action is neutral here, with both an emerging ABC corrective structure and a possible bearish W continuation pattern visible on the chart, so traders should treat this as a balance area between support and resistance.
Bitcoin weekly chart week 51 2025 with prior lows resistance at $93.738,20, neckline and $80.734,37 shoulder support forming potential ABC or bearish W structure.
Technical Analysis Key Points
- After the sharp and impulsive sell-off in November 2025, the price made a bullish rebounce but was capped against the prior lows at $93.738,20.
- The weekly zone above that level has served as resistance in the two following weeks.
- This week we retested the lows.
- This could go both ways :
- Bullish : this could be the start of an ABC correction of the bearish leg down. As the last impulse bearish leg down touched the weekly shoulder level at $80.734,37, we could say a key level was hit and an ABC correction would be valid. But we also still correct the impulsive wick in a more structural way.
- Bearish : we Interprete the actual ranging as an natural bearish W. Therefore we need to retest the highs again. Then we could see a retest of the shoulder level again.
Market Structure Analysis
Structure on week 51 is defined by the impulsive November leg down into the weekly shoulder, followed by a failed rebound that stopped exactly at the prior lows around $93.7k.
The zone just above that level has now acted as resistance for two consecutive weeks, reinforcing it as the key weekly cap.
Below price, the neckline area around mid-$86k and the shoulder at $80.734,37 are the main supports.
From a technical analysis perspective, this is a classic range where traders watch for either an ABC corrective advance off a key higher-timeframe level, or a bearish W where repeated tests of support eventually give way to continuation lower.
Fibonacci retracements of the November sell-off can help gauge whether any upside is merely corrective or the beginning of a larger trend reversal, but confirmation will come from weekly closes outside this range.
Key Levels and Scenarios
Bullish scenario: buyers defend current lows and print a clear weekly reversal above the neckline, then break and close through $93.738,20, confirming an ABC correction higher and invalidating the immediate bearish W narrative.
Key levels to watch:
$93.738,20 – prior lows and main weekly resistance that must break for upside continuation
Weekly resistance zone above $93.7k – supply area capping the last two weekly candles
Neckline area (~$86k) – mid-range pivot; holding above favors the ABC scenario
$80.734,37 shoulder – major support; a key reaction level for both bulls and bears
Deeper levels below the shoulder – risk zone if the bearish W plays out and support fails
Trading Implications
Given the two-sided structure, we see better risk/reward in waiting for a weekly close above $93.7k or below the shoulder before committing size, while short-term traders can work the range with tight invalidation around these clearly defined support resistance zones.
This analysis is not financial advice; always do your own research and manage your risk before trading.