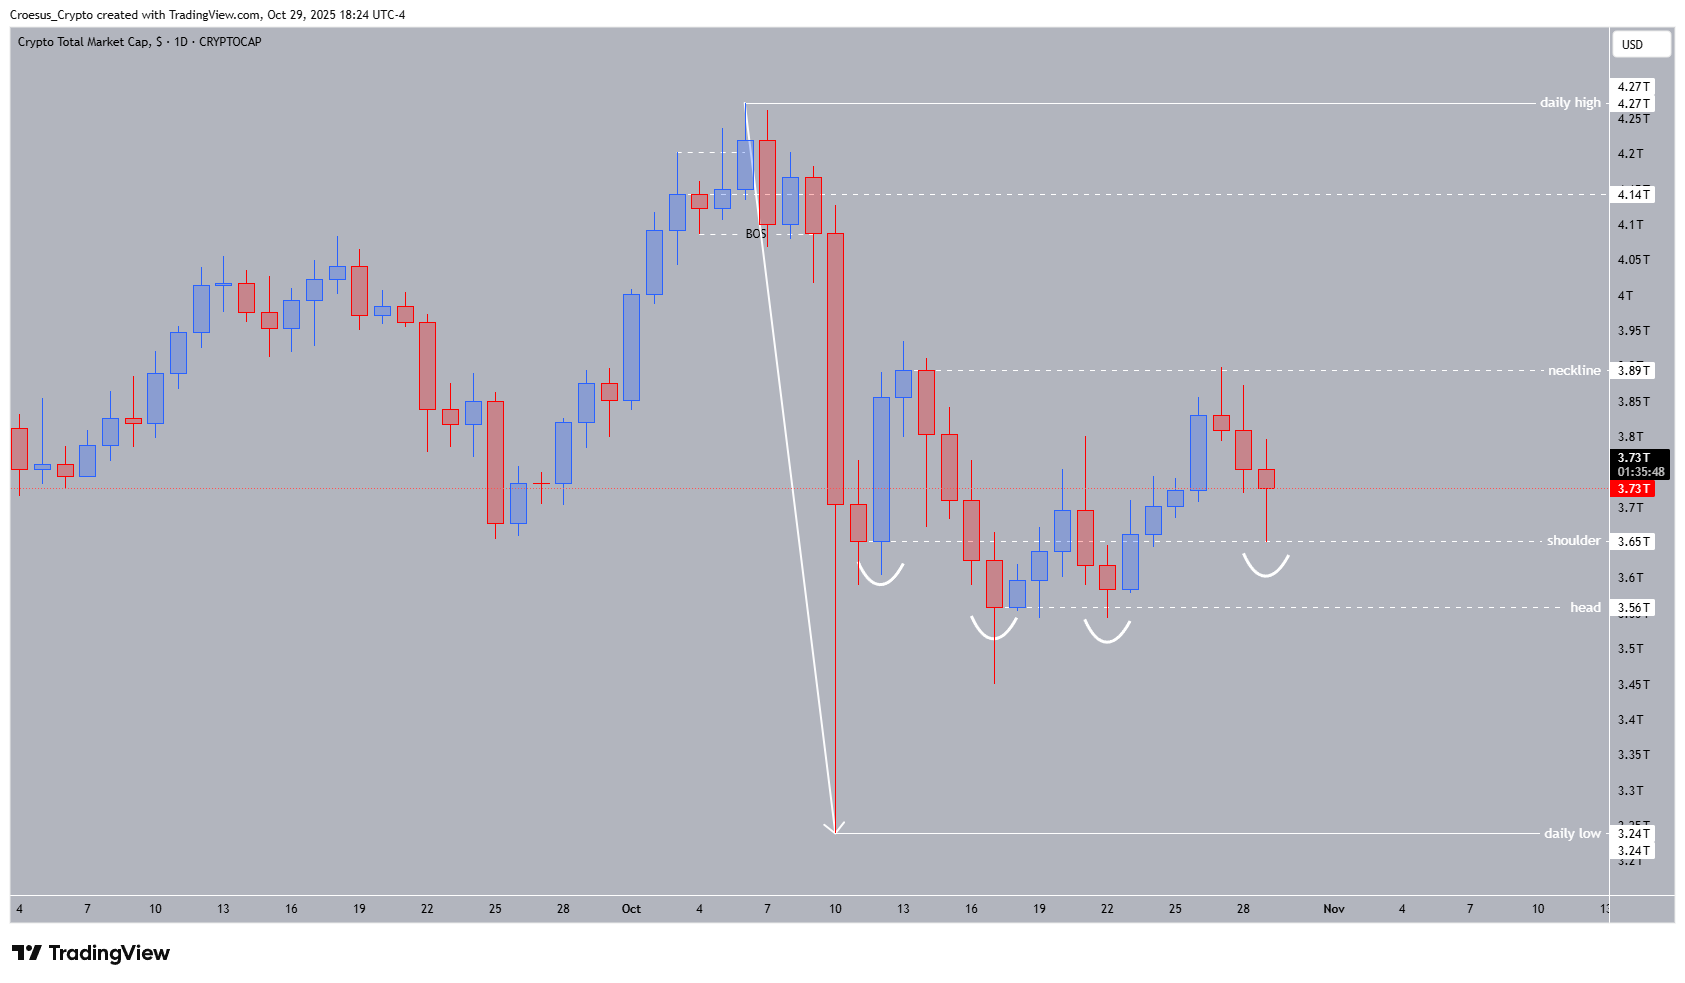
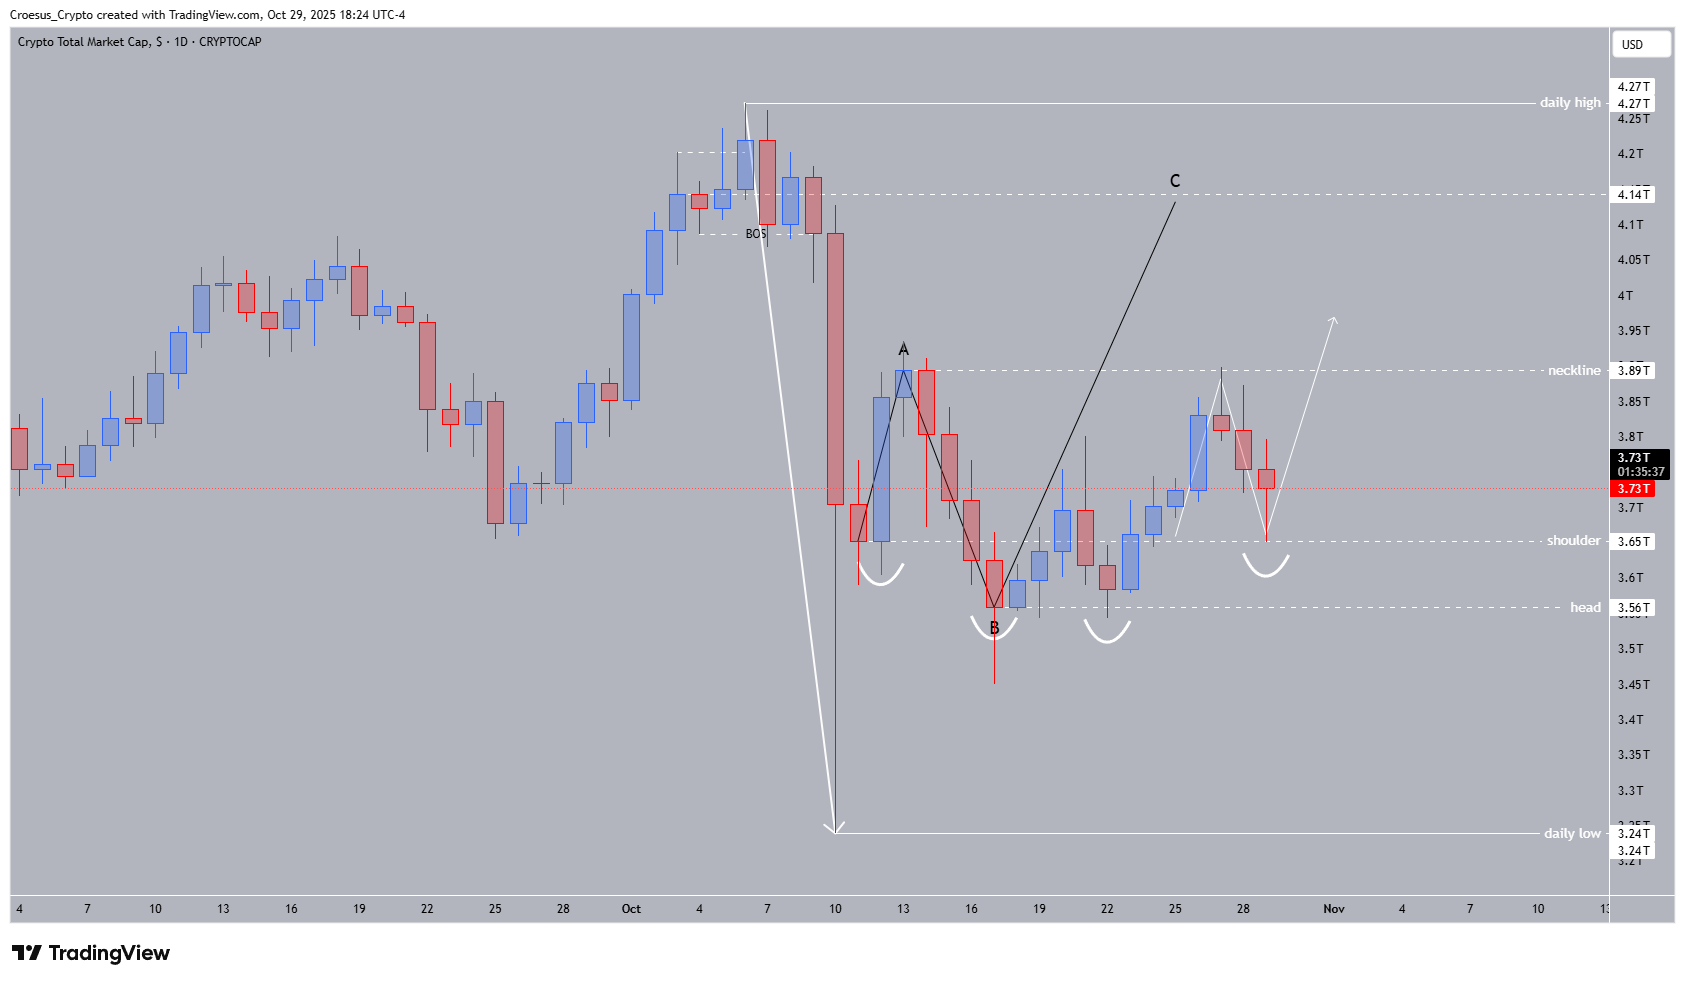
Reaching the entry zone means that we have to look on the lower timeframe 4H to find a fitting entry point.
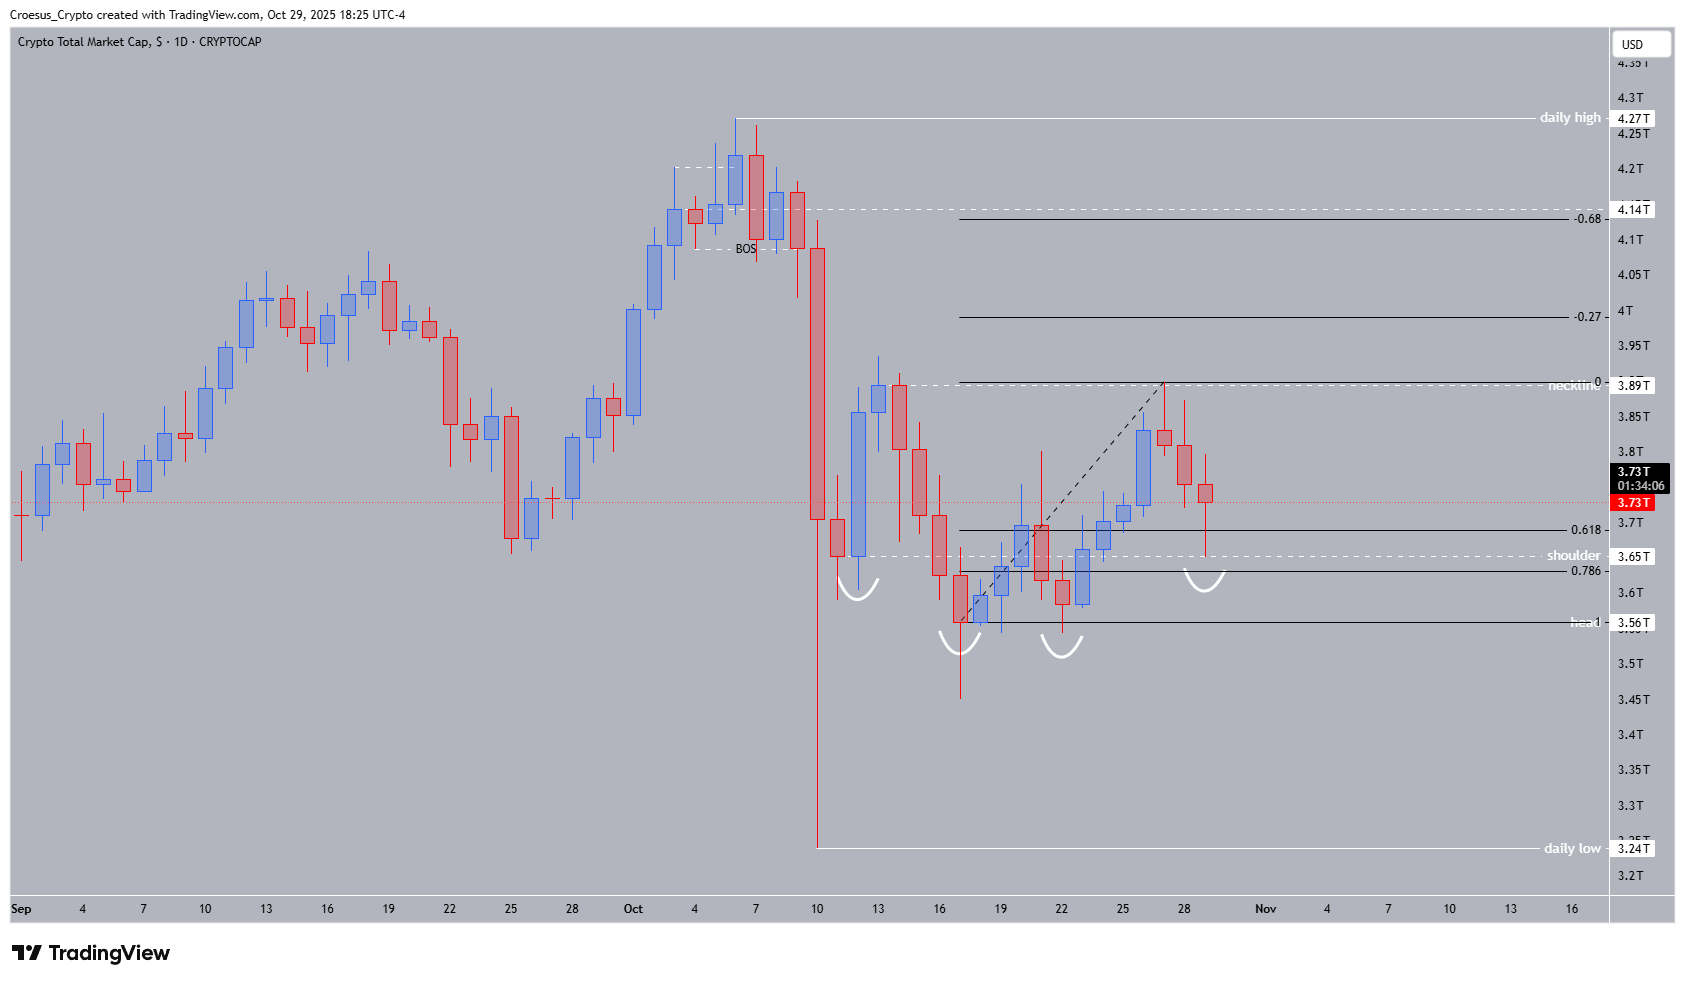
If we take the Fibonacci retracement of the inverse head and shoulder, we can see that we have two take profit points. The first is situated on the fib level -0.27/3.99T. The second one is situated on the fib level -0.68/4.13T, just below the daily shoulder level of the head and shoulder pattern.
Continue to act with caution : we are still in a bearish trend. If somewhere down the line there is a lack of confidence in the market, price may reverse quickly. Remark : the index did not correct the one impulsive bearish candle yet, not even after 14 days. Bulls try, but are not convincing yet.