

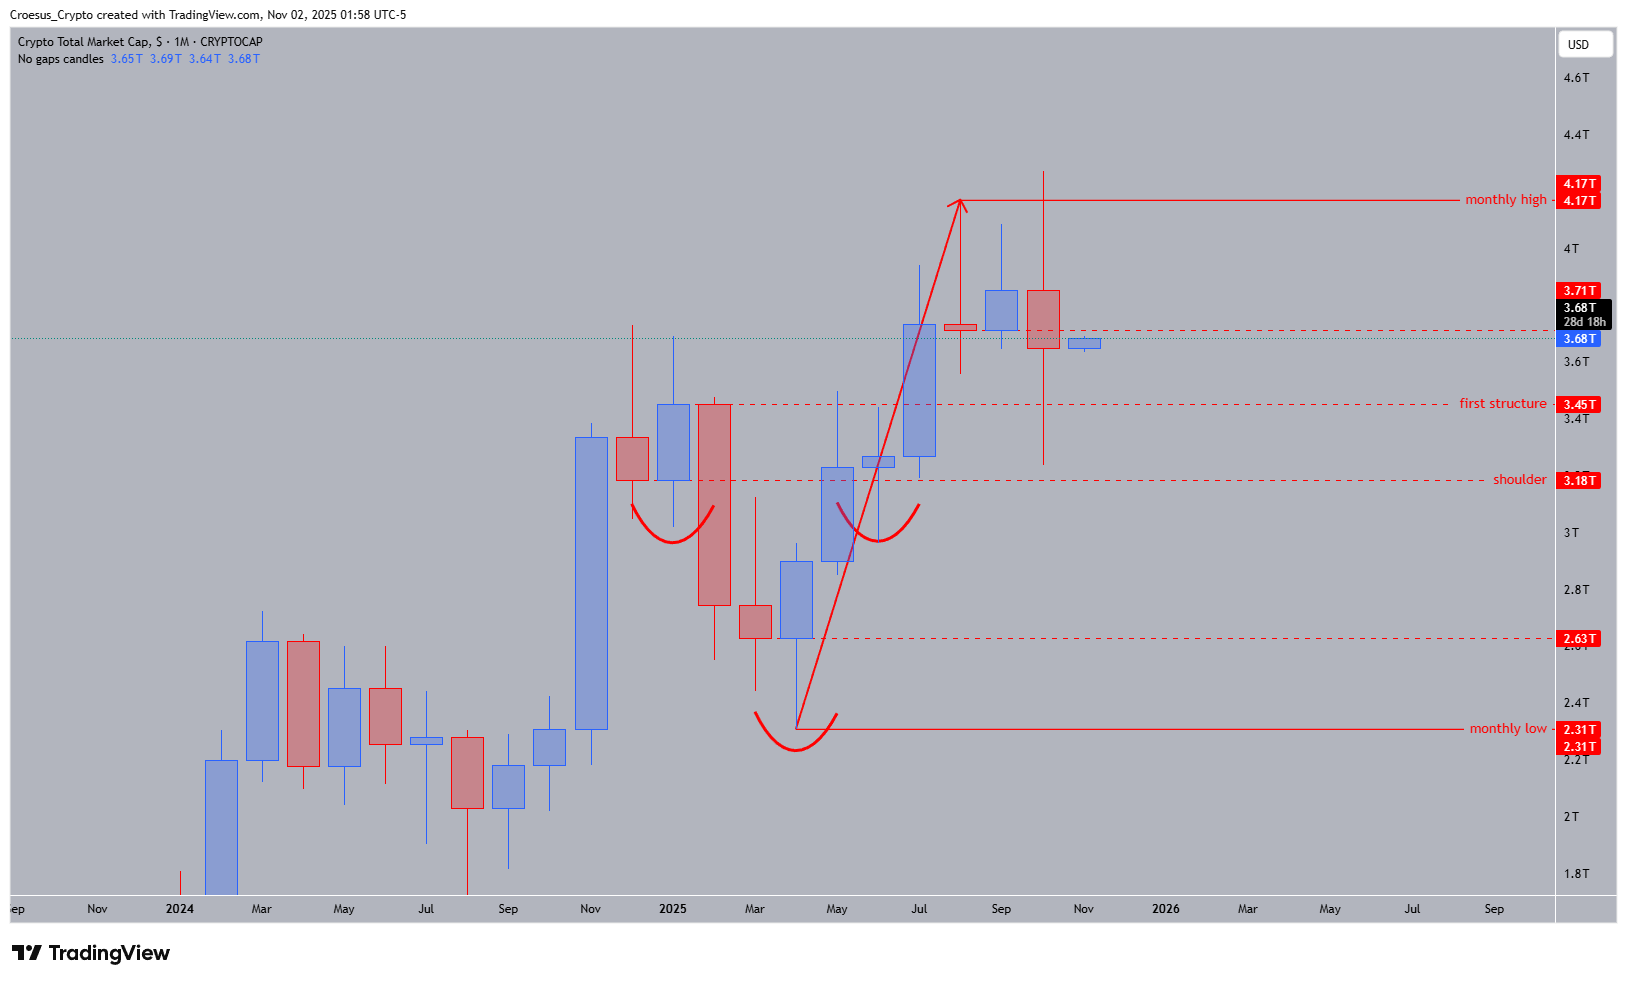
- Index made a clear inverse head and shoulder pattern
- This month the index made a liquidity grab above the swing high, but then corrected sharply retesting the first structure
- Afterwards the index corrected fast, ending in an indecision candle (equal length of wicks and relatively small body)
- Where the correction to the downside was made impulsively, we can still see a structural correction, targeting even the shoulder level
Market Structure Analysis
The TOTAL crypto market cap monthly analysis shows a developing inverse head and shoulders pattern - a classic bullish reversal formation. The recent liquidity sweep above the previous swing high triggered stop losses before sharp rejection, which is typical accumulation behavior before major moves.
Current price action is retesting the first structure support zone, coinciding with the 0.382 Fibonacci retracement level. The indecision candle from last month signals market equilibrium before a decisive move. Volume patterns show decreasing selling pressure from head to right shoulder, supporting the bullish scenario.
Key Levels and Scenarios
Bullish Scenario: Break above neckline resistance activates pattern targets at +15% (1.272 Fib extension), +28% (1.618 extension), and +40% (full projection). Confirmation requires volume increase and Bitcoin/Ethereum strength.
Bearish Scenario: Break below first structure (0.382 Fib) opens path to shoulder level at 0.618 Fibonacci (-12%). This would still maintain pattern validity but delay bullish resolution.
- Neckline: Bullish breakout resistance
- First Structure (0.382 Fib): Current support test
- Shoulder Level (0.618 Fib): Must-hold zone for bulls
- Previous High: Liquidity sweep overhead resistance
Trading Implications
Current setup offers favorable risk/reward for long positions at first structure with stops below 0.5 Fibonacci. Swing traders can enter here, while conservative traders wait for neckline breakout confirmation. Position size maximum 2-5% of portfolio with defined stop losses.