

The TOTAL index is moving through Phase 1 of a weekly corrective move after a sharp breakdown. The market is oscillating between the weekly IC level and the band of prior lows, but without a decisive weekly close above or below these areas. This keeps the higher time frame picture bearish while the short term works off oversold conditions.
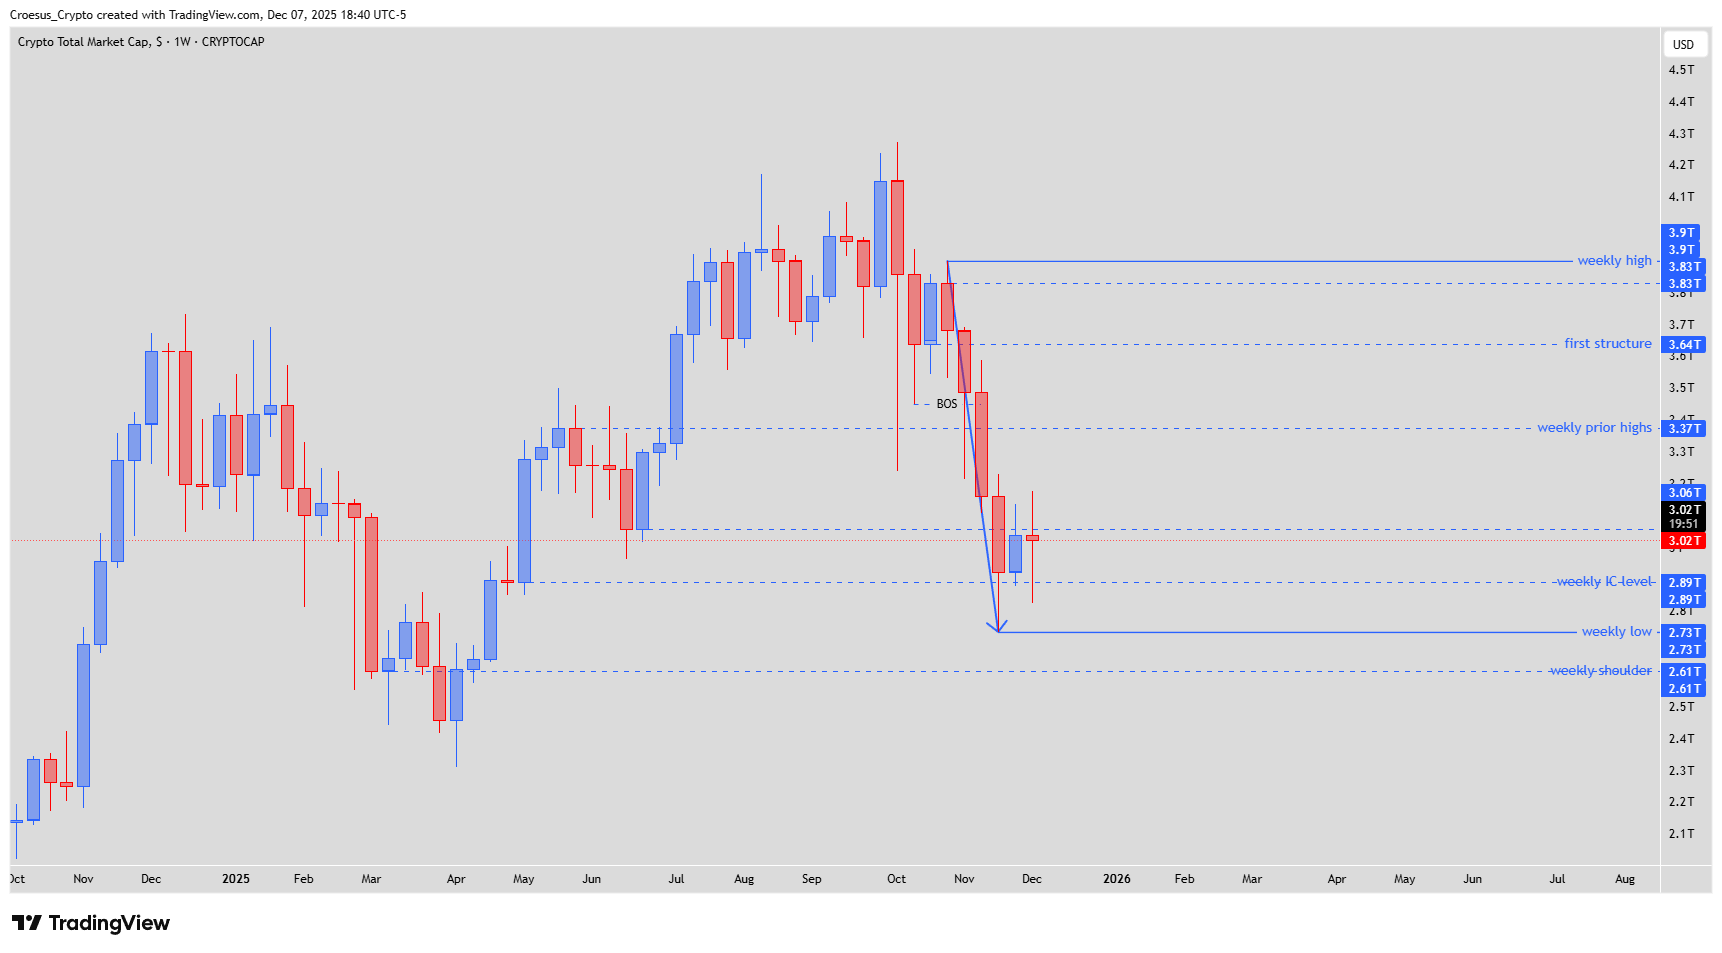
TOTAL weekly chart – Week 47 2025 showing bearish leg down into weekly low and reaction
Technical Analysis Key Points
- Where we saw the index retest the weekly prior lows last week, this week we saw a retest of the weekly IC level followed by a retest of the prior lows.
- As long as we don't see a break and retest of the prior lows, there is no clear decision wether we see a bullish correction or a bearish continuation.
- Take into account : even when we see a bullish relief, the index is still in a bearish leg down.
Market Structure Analysis
After the break of structure to the downside, the index sold off sharply from the region just below the weekly high near $3,90T toward the weekly low around $2,73T, with a deeper reference level at the weekly shoulder near $2,61T.
Last week price bounced from that weekly low area and pushed back up into the region of the weekly prior lows around $3,02T, which now acts as resistance rather than support.
This week we saw price test the weekly IC level around $2,89T and then move back up toward the prior lows again, confirming that this band between roughly $2,89T and $3,02T is the active corrective range.
Above the market there is layered resistance: first the weekly prior highs near $3,37T and then the first structure level around $3,64T, with the ultimate reference at the weekly high around $3,90T.
Until one of these key zones is broken and retested, the weekly structure stays that of a strong bearish leg followed by a corrective consolidation.
Key Levels and Scenarios
Key levels
Weekly high resistance: about $3,90T
First structure resistance: about $3,64T
Weekly prior highs resistance: about $3,37T
Band of weekly prior lows: about $3,02T
Weekly IC level: about $2,89T
Weekly low support: about $2,73T
Weekly shoulder support: about $2,61T
Bullish scenario
Buyers defend the weekly IC level around $2,89T and the weekly low near $2,73T.
The index then closes a weekly candle back above the band of prior lows around $3,02T and later retests this zone as support.
If that retest holds, the corrective bullish leg can extend toward the weekly prior highs at $3,37T and possibly into the first structure region near $3,64T.
Even in this scenario the move is a relief rally inside a still dominant bearish leg unless the market can later reclaim and hold above $3,64T–$3,90T.
Bearish scenario
The index fails to reclaim the weekly prior lows and repeatedly rejects from the $3,02T area.
A decisive weekly close back below the weekly IC level at $2,89T signals that sellers are taking back control.
Follow through selling then targets the weekly low at $2,73T.
If this level breaks and flips to resistance, continuation toward the weekly shoulder around $2,61T becomes likely and would confirm that the broader bearish trend is resuming after only a shallow correction.
Trading implications
For traders looking at long exposure
Any longs here are counter trend on the weekly chart and belong to a corrective context. They make more sense only if there is a clear weekly close above the prior lows around $3,02T followed by a successful retest of that zone as support. Position size and risk per trade should stay modest.
For traders looking at short exposure
Rejections from the band of prior lows around $3,02T, combined with weakness back below $2,89T, offer higher time frame short opportunities in line with the main bearish trend. Invalidation sits above the rejected resistance zone.
For traders waiting for confirmation
If price keeps bouncing between $2,89T and $3,02T without a weekly close outside this range, it remains a corrective chop zone.
Clearer signals will appear once the market either reclaims $3,02T as support for a deeper relief rally, or loses $2,89T and later $2,73T, confirming that the weekly bearish leg is ready to extend.
This analysis is for educational and informational purposes only and is not financial advice. Always do your own research and make your own trading decisions. Trading and investing in crypto assets involve significant risk, including the risk of loss of capital.