


TOTAL daily analysis for December 2025 highlights continued bearish control after repeated failures at the daily entry zone and a clean 4H head and shoulder pattern.
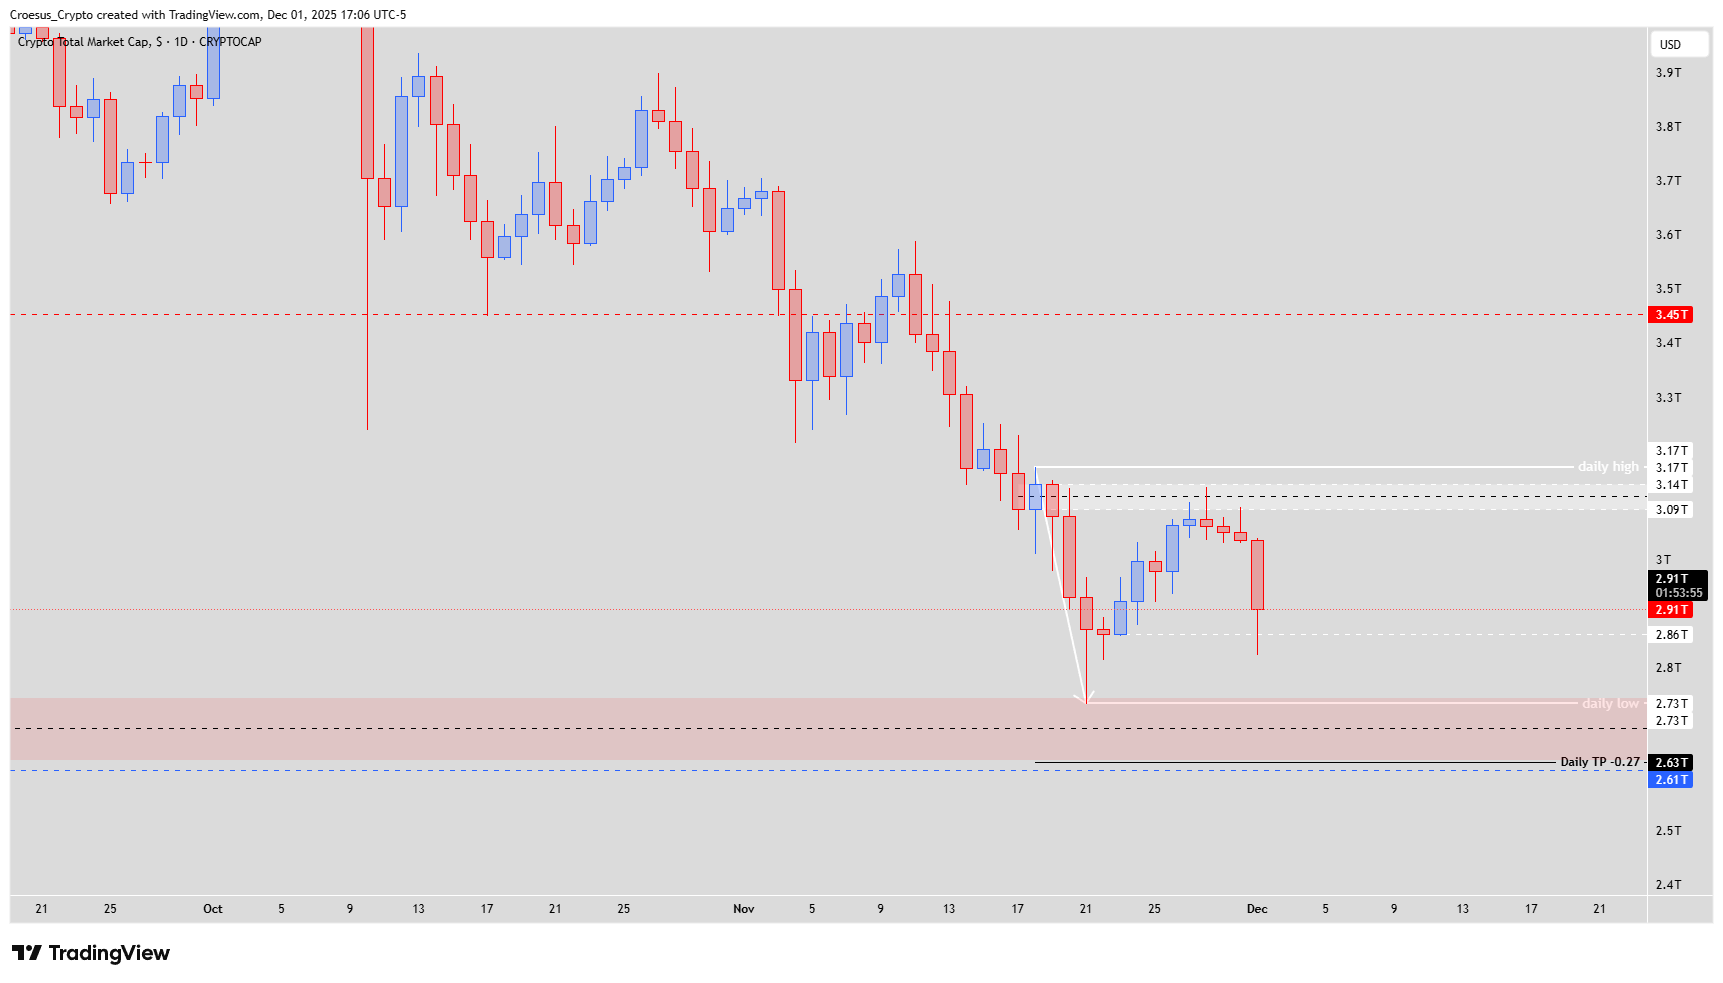
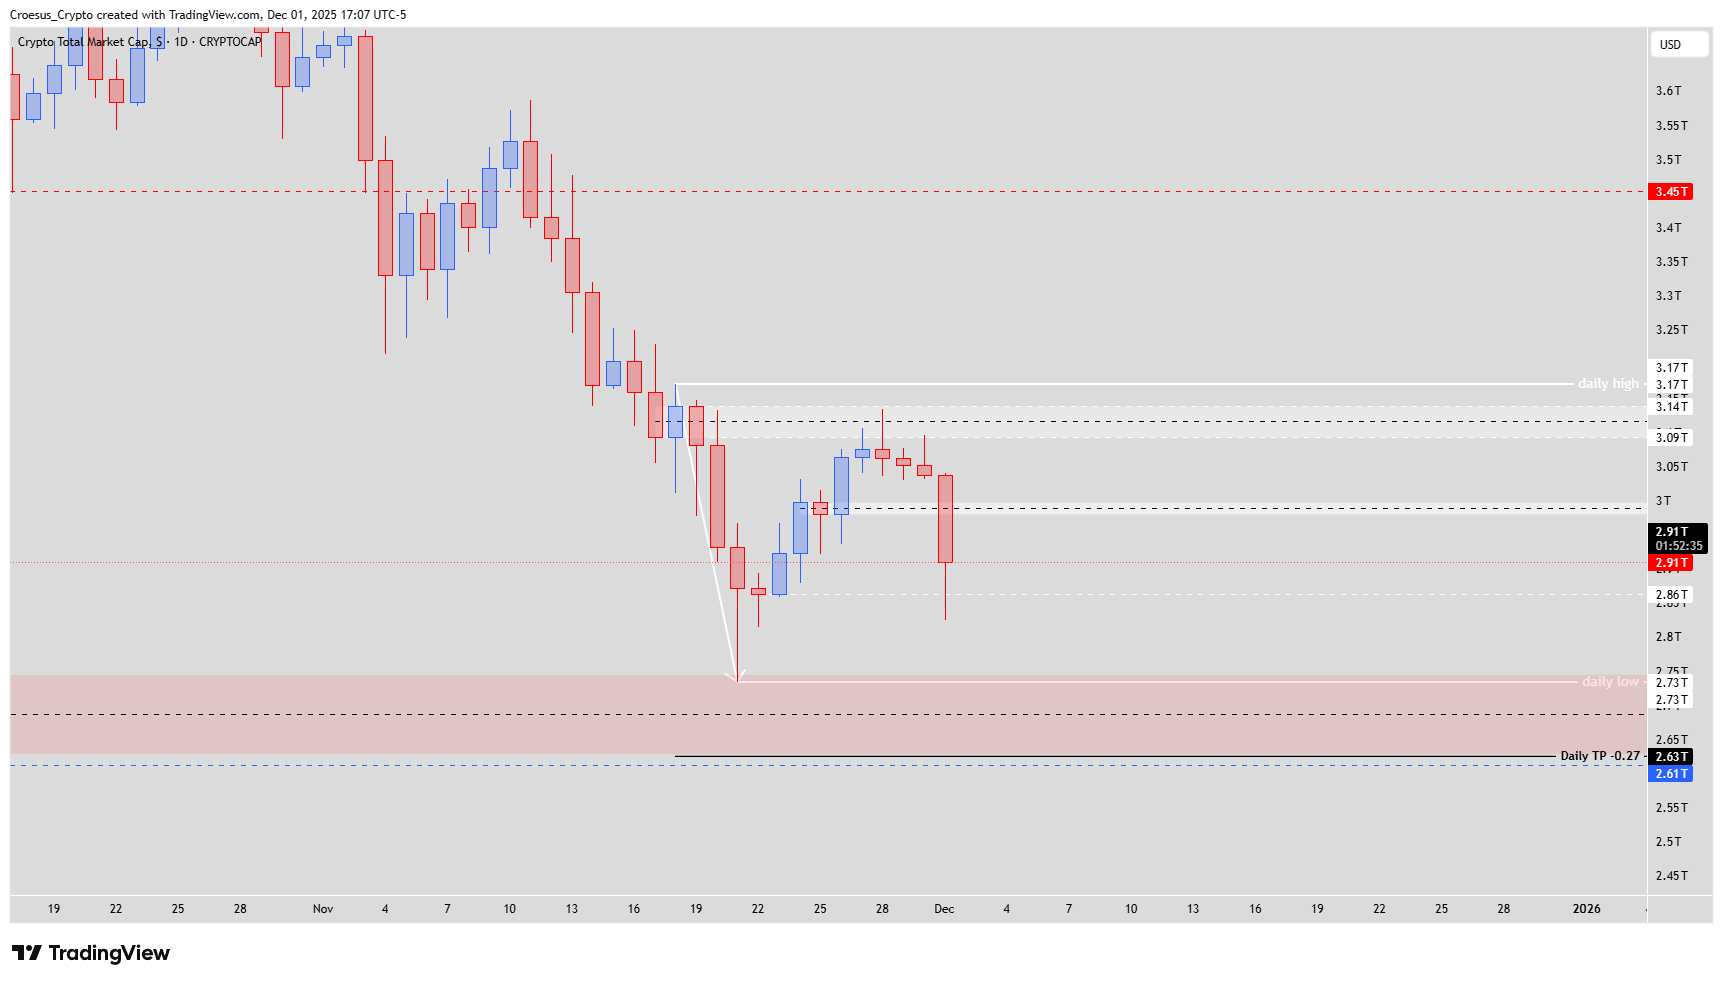
TOTAL daily chart 01 Dec 2025 with broader downtrend, resistance near 3.09T and downside targets at 2.63T–2.61T.
Trend = bearish
Technical Analysis Key Points
- Yesterday the index saw the fourth consecutive rejection of the daily entry zone.
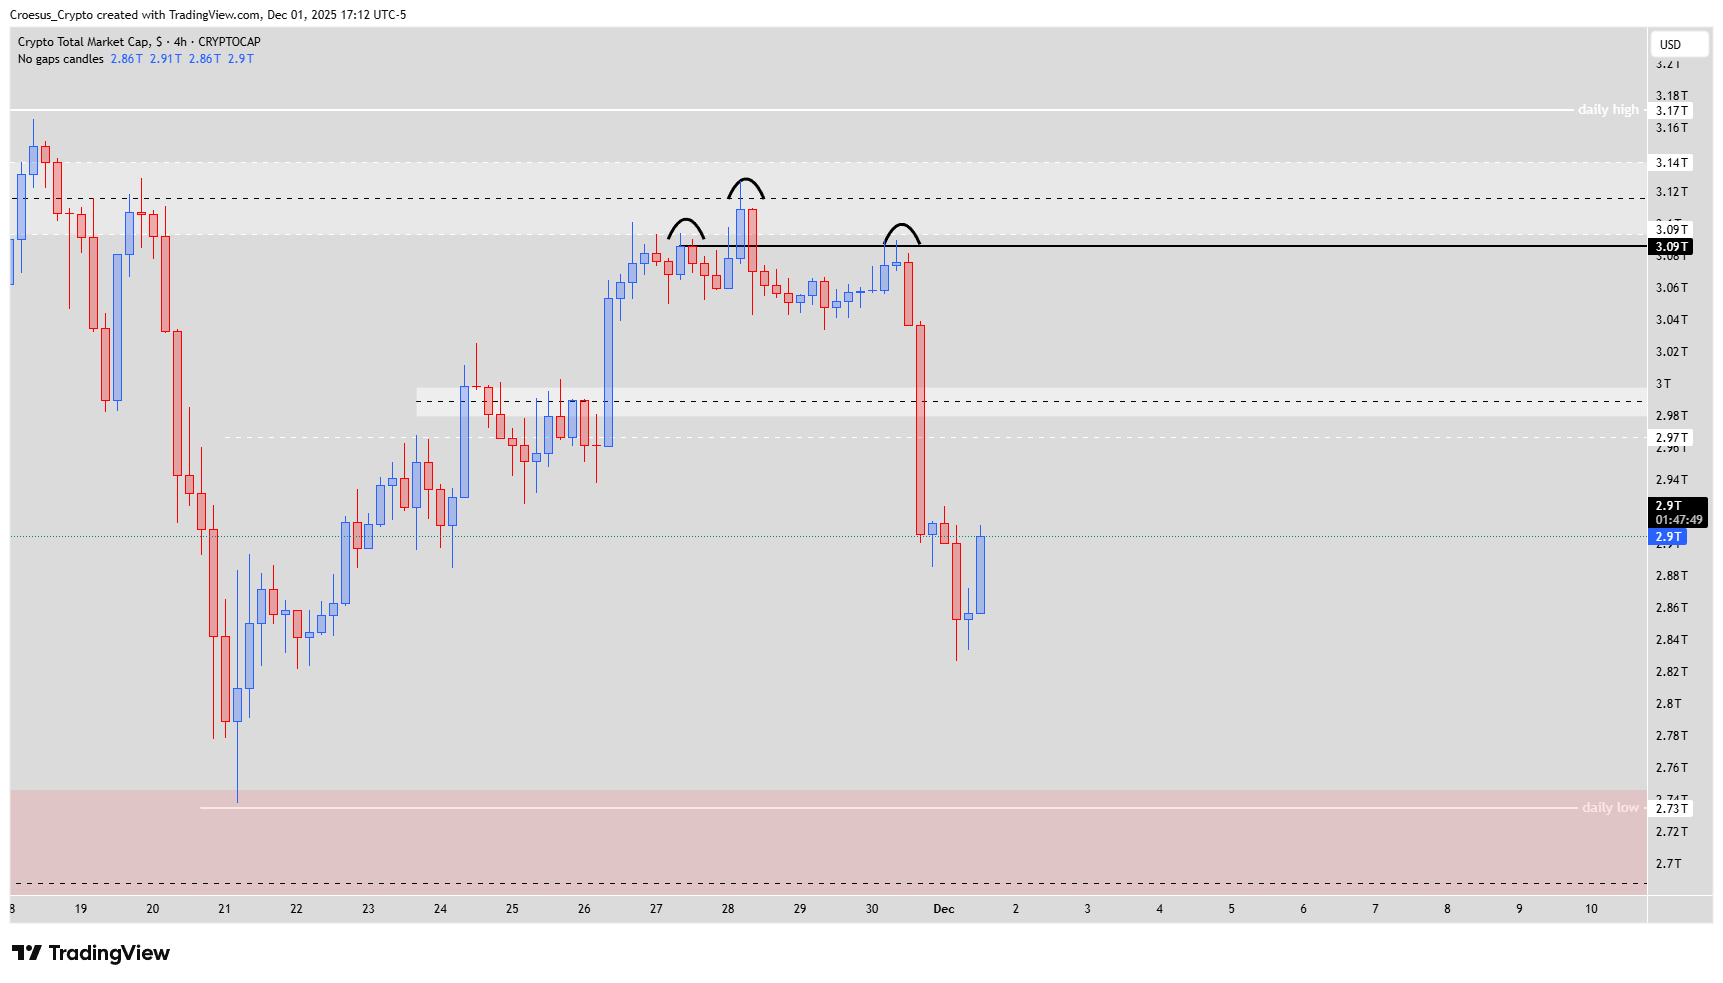
- Today we saw the impulsive bearish drop, showing us that bears are still more powerful than bulls actually. 7 bullish candles were corrected in one bearish move.
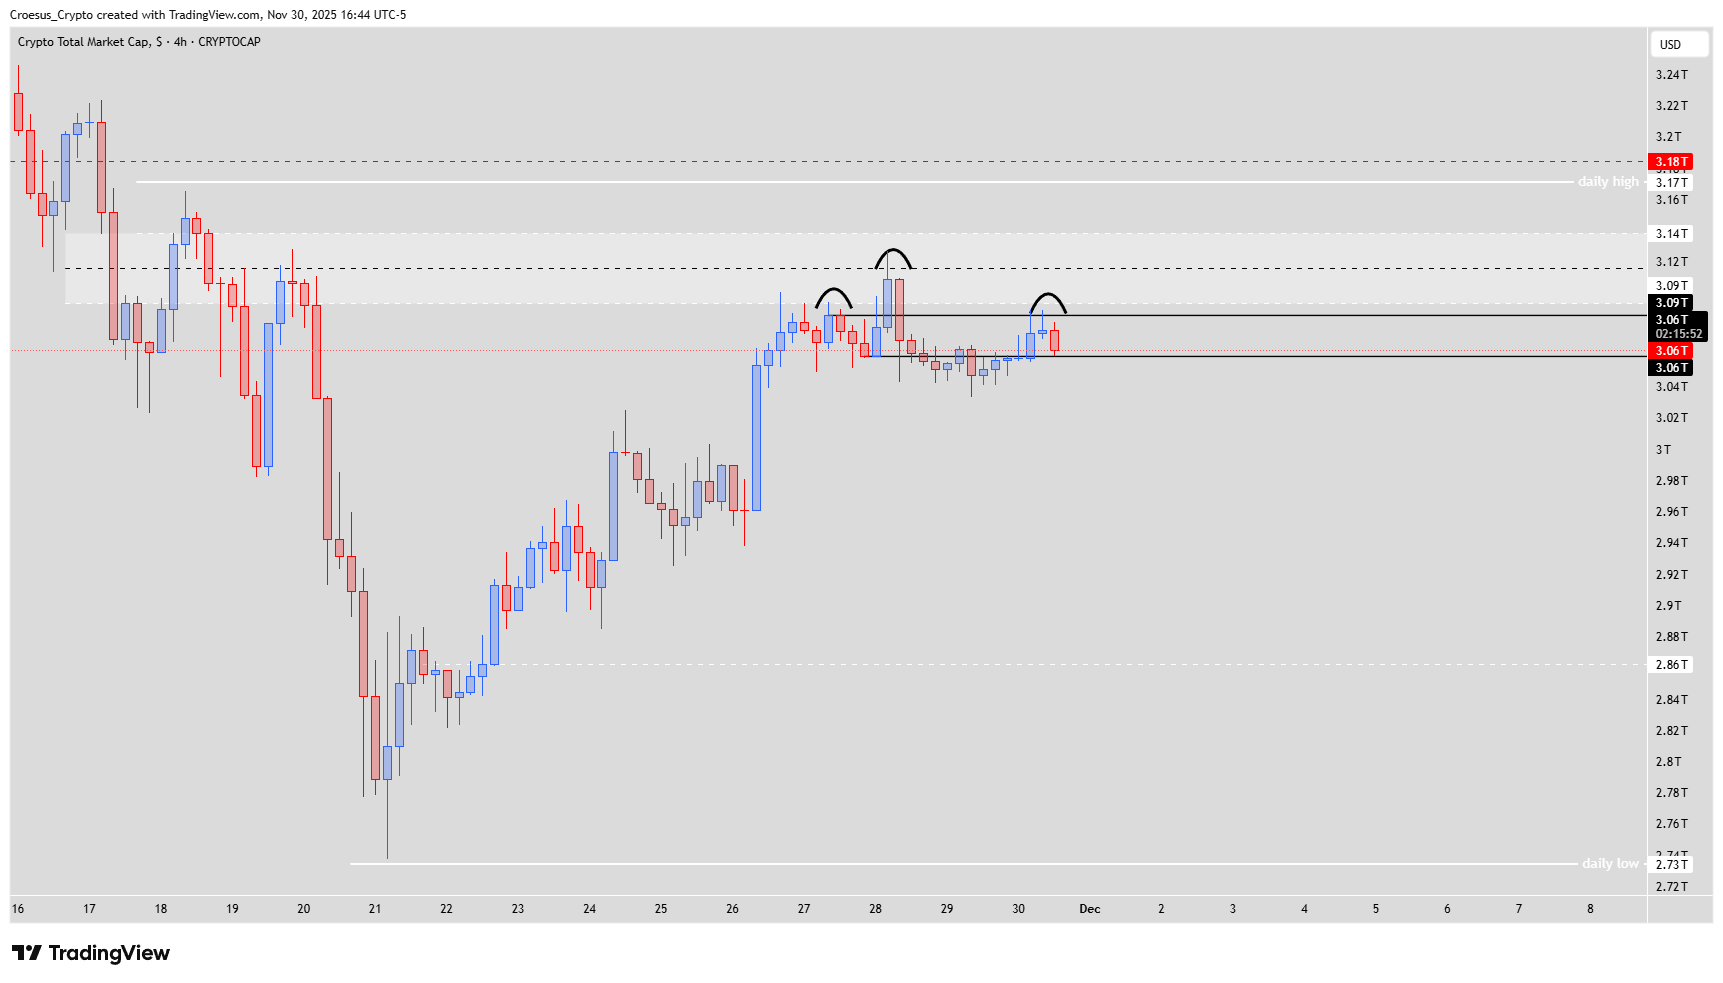
- As analyzed, the 4H showed us a beautiful head and shoulder pattern that played out very good. I don't know if there are futures that represent the TOTAL index, but a short with an entry @3.09T would have been a very nice entry opportunity.
- The price could retrace again, consolidating after such a bearish drop. A complete recovery of the bearish candle is possible, preferably taking several days, showing us that bulls still don't have enough power to reclaim momentum.
- A zone of interest for us is the 2.97T zone, where there is an institutional candle and a possible formation of a head and shoulder pattern on the daily time frame
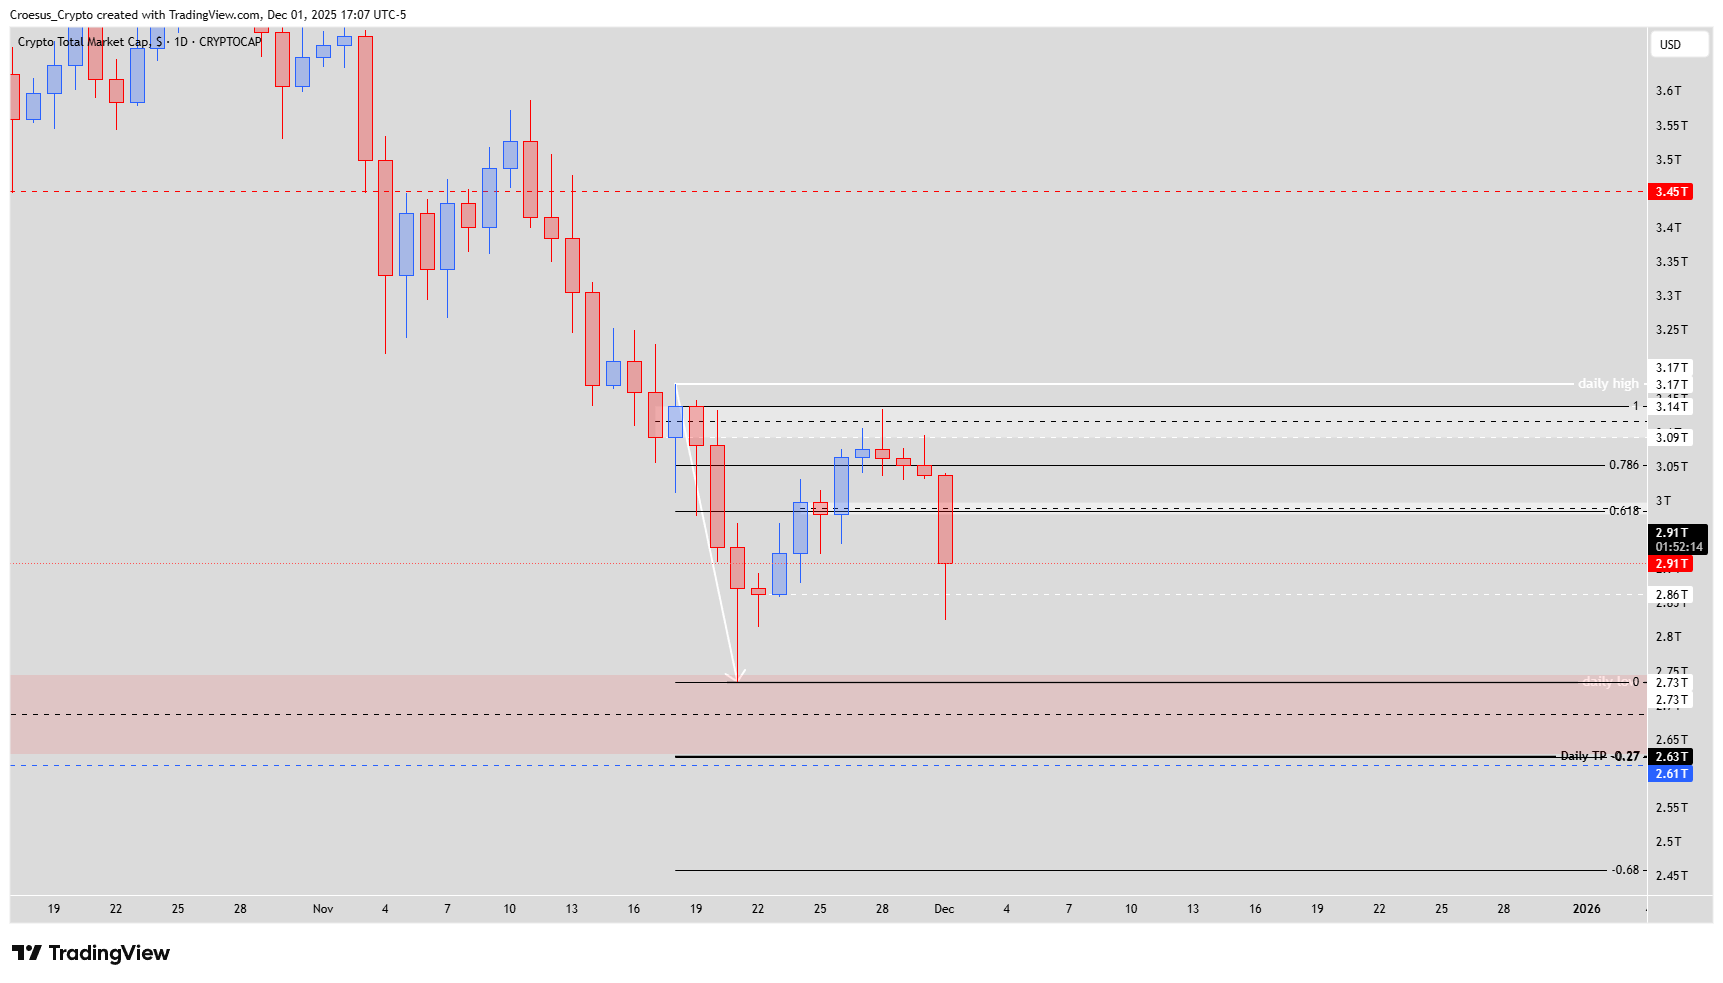
- First target at this moment is still the 2.63T level = -0.27 fib level
Market Structure Analysis
Our TOTAL daily timeframe analysis shows a clear rejection of resistance around the prior daily entry zone, confirming it as strong support resistance flip. The 4H head and shoulder pattern around 3.09T already completed, with the neckline break leading to an impulsive sell-off that erased seven sessions of grind-up price action in a single candle. This tells us momentum firmly favors sellers.
Any rebound that slowly retraces today’s bearish candle over several days would, in our view, just be a corrective move back into premium prices rather than a trend change. The 2.97T “institutional candle” area aligns with this idea and could become the next lower-high zone or even host a new head and shoulder formation on the daily chart. The broader technical analysis context remains a sequence of lower highs and lower lows, with Fibonacci projections pointing to 2.63T as a logical extension target.
Key Levels and Scenarios
Bullish scenario (corrective only): Bulls need to reclaim and hold above the daily entry zone to neutralize immediate downside; otherwise, any bounce into 2.97T–3.00T looks like a short-term shorting area rather than a reversal.
Key levels to watch:
3.09T resistance: Former short entry and head & shoulder completion zone; major support resistance pivot.
Daily entry zone (~3.0T region): Four rejections; reclaiming it would be first sign bears are losing control.
2.97T zone: Institutional candle and potential daily H&S area; ideal for monitoring bearish reaction.
2.73T daily low area: Intermediate demand; loss of this level opens path to deeper extension.
2.63T target (-0.27 Fibonacci): Primary downside objective from the current swing and core focus of this TOTAL daily analysis.
Trading Implications
For active traders, we see better risk/reward on waiting for slow, corrective bounces into 2.97T–3.0T supply to look for bearish continuation setups, keeping invalidation just above recent highs and sizing positions conservatively relative to overall portfolio risk.
This analysis is for educational purposes only and is not financial advice or a recommendation to buy or sell any asset.