TOTAL Marketcap / Crypto Total Market Cap
TOTAL daily analysis 02/03/2026. The total crypto market cap index is trading in a bearish environment while testing a potential reversal structure, with price action currently stuck between the shoulder level and the neckline.
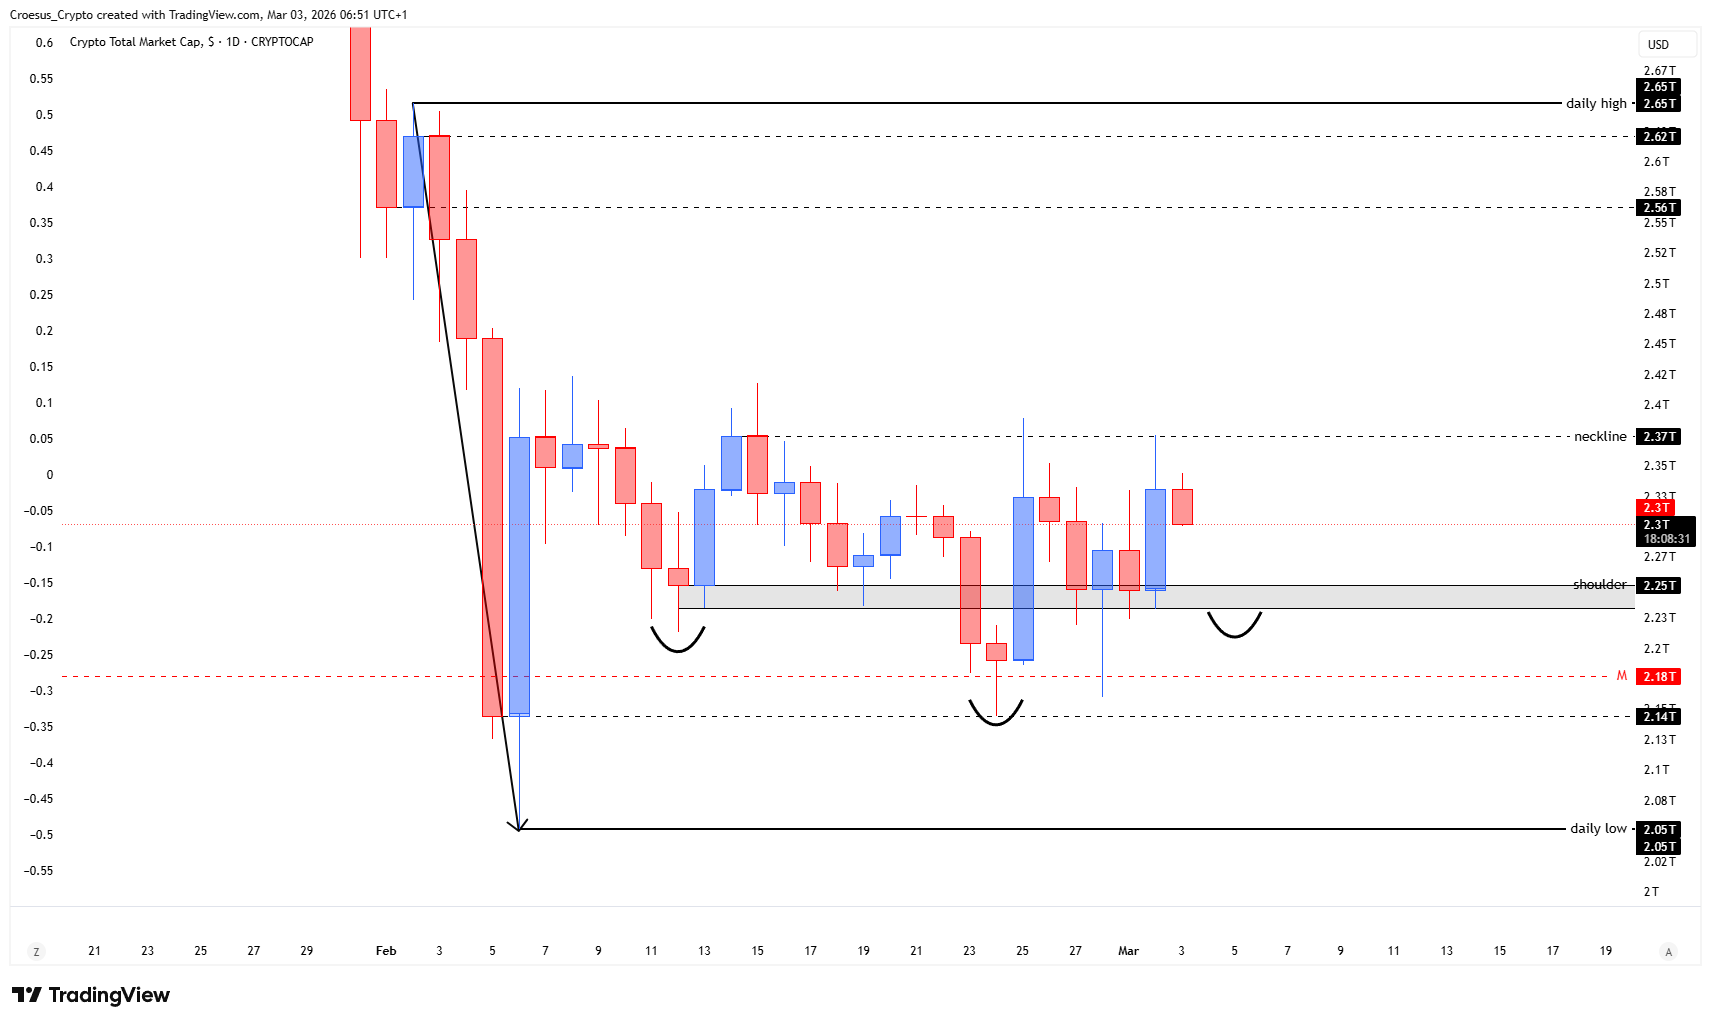
- Over the weekend we retested the shoulder level but that level did not get respected (closes below that level). This indicates us that, when hitting or breaking the neckline, we might see a retest of the shoulderlevel in order to respect it then.
- At this moment, the index is in a reversal. The index is turning but hasn't turned yet. The movement is not completed or confirmed. Only when we see a confirmed close above the neckline. Notice the difference between "the price or index is turning" (action is busy but is not completed) and "the price or index has turned (action is completed).
- Eventhough this is a bullish set-up, initiating potentially a bullish reversal, we might still see a bearish activitiy. Thight riskmanagement is in order when taking this trade.
Market Structure Analysis
From a market structure perspective, TOTAL daily analysis remains bearish as long as price accepts below the shoulder level and fails to reclaim it on a closing basis. The weekend retest that “did not get respected” signals weak demand at that horizontal support, and it often precedes a second interaction with the neckline where liquidity gets tested again.
Structurally, our focus is on whether the current move is a corrective pullback within a broader downtrend, or the early stage of a reversal that still needs confirmation.
In Croesus methodology, “turning” is not the same as “has turned”: the reversal only becomes actionable after a confirmed close above the neckline, which would shift structure from corrective to impulsive and turn prior resistance into potential support.
Key Levels and Scenarios
In this TOTAL daily analysis, the bullish scenario requires a clean reclaim and confirmed close above the neckline, ideally followed by acceptance and a retest that holds as support resistance flips. The bearish scenario remains active if price keeps closing below the shoulder level and rejects from the neckline area, which would validate continued bearish activity despite the developing reversal attempt.
- Neckline level: confirmation trigger; a confirmed close above is required for the reversal to be “completed”
- Shoulder level: key structural support; failure to hold it keeps the bearish bias in place
- Neckline zone retest: potential decision area where a breakout can fail or confirm with acceptance
- Shoulderlevel retest after neckline interaction: possible support validation if structure flips
Trading Implications
Given the mixed signals (bearish trend but a potentially bullish set-up), positioning is more about confirmation than prediction. Conservative participation typically waits for the confirmed neckline close, while aggressive participation faces higher invalidation risk if bearish pressure remains dominant around the shoulder/neckline structure.
This analysis is for informational purposes only and does not constitute financial advice.