


Crypto Total Market Cap daily analysis for December 2025 focuses on the index testing the current daily high while sitting above the institutional candle (IC) zone and key weekly levels. This TOTAL daily analysis tracks whether momentum can genuinely flip bullish or if the earlier bearish structure reasserts itself, in line with our naked technical analysis approach.
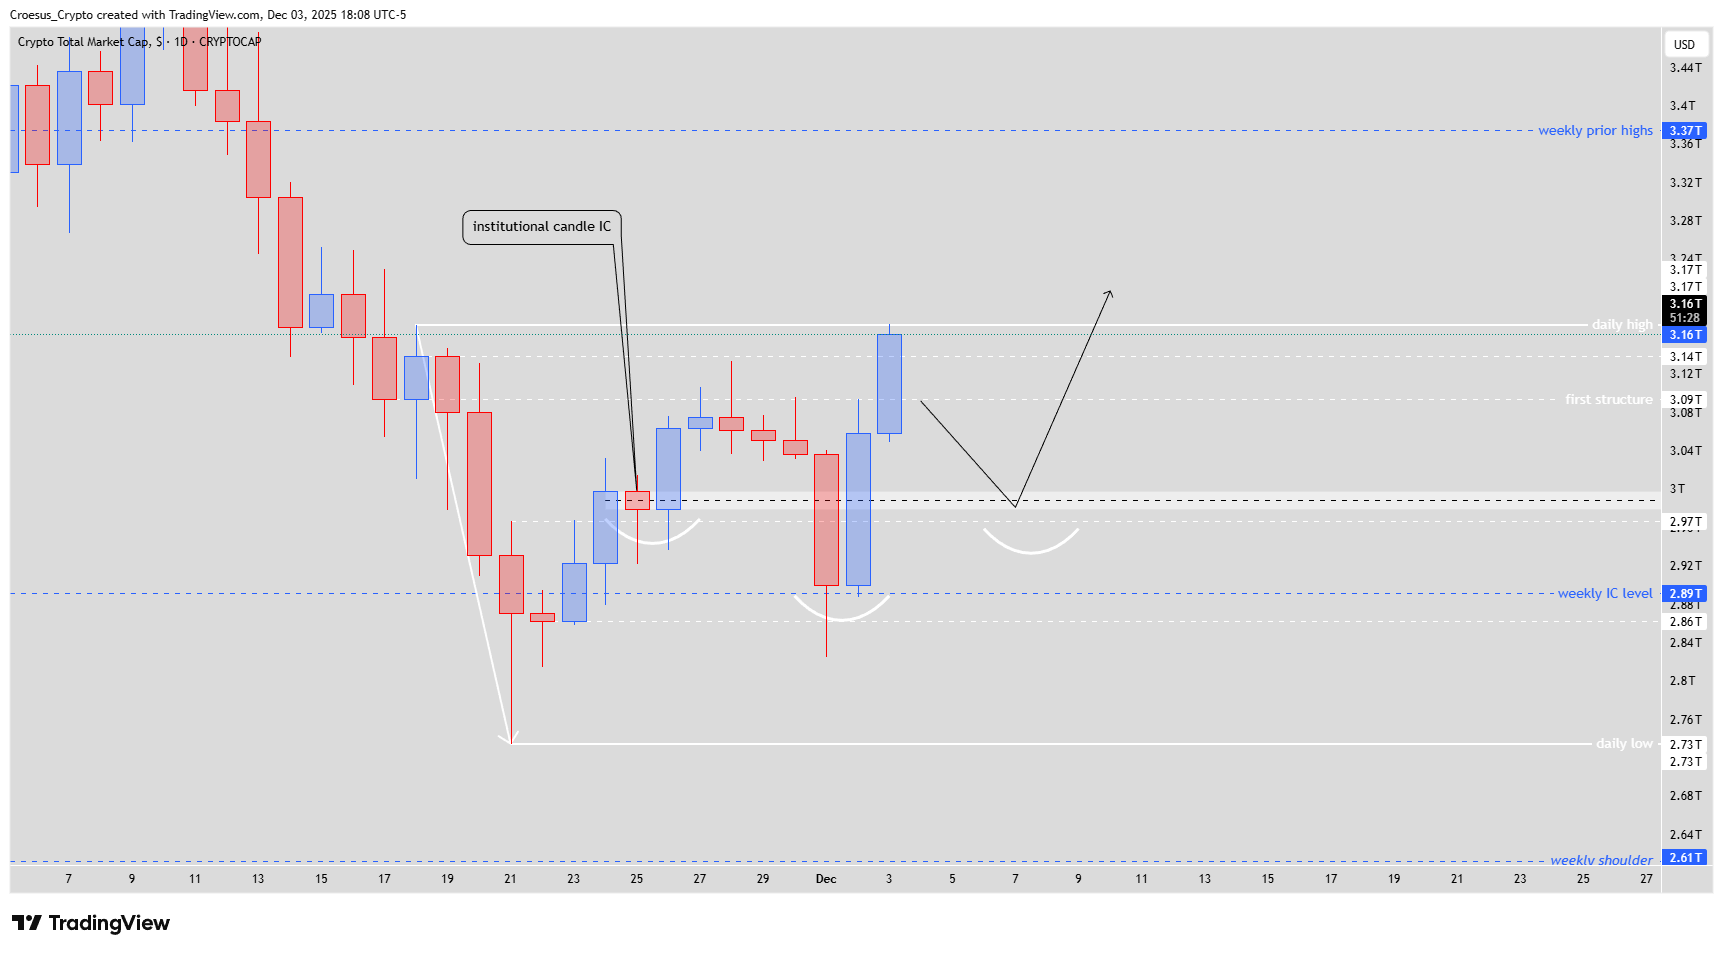
TOTAL daily chart 3 Dec 2025 highlighting strong bounce from IC-zone toward daily high within broader weekly support context
Trend = bearish
Technical Analysis Key Points
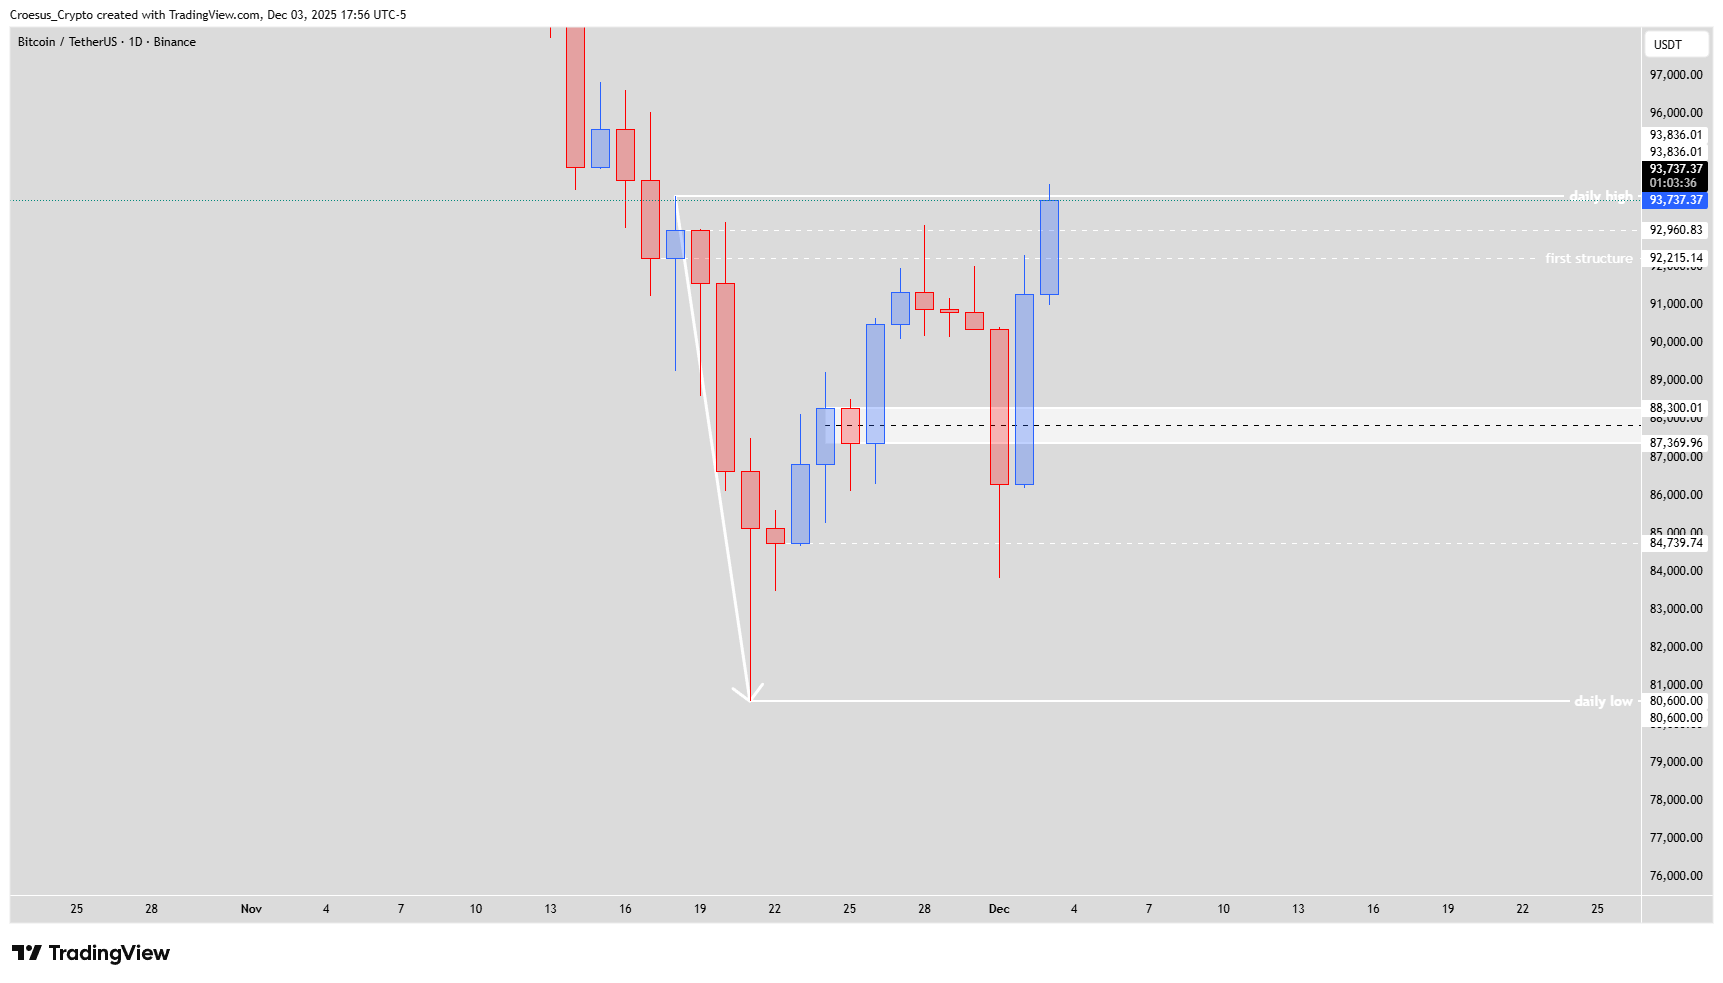
- Today the index continued pushing higher and is testing the daily high. When the candle closes above that level, we can see the bullish set-up develop. When the candle closes below that level, the bearish set-up remains valid.
- Bullish = switch of momentum + if the IC-zone holds as strong support zone for a bullish reversal, printing a inverse head and shoulder.
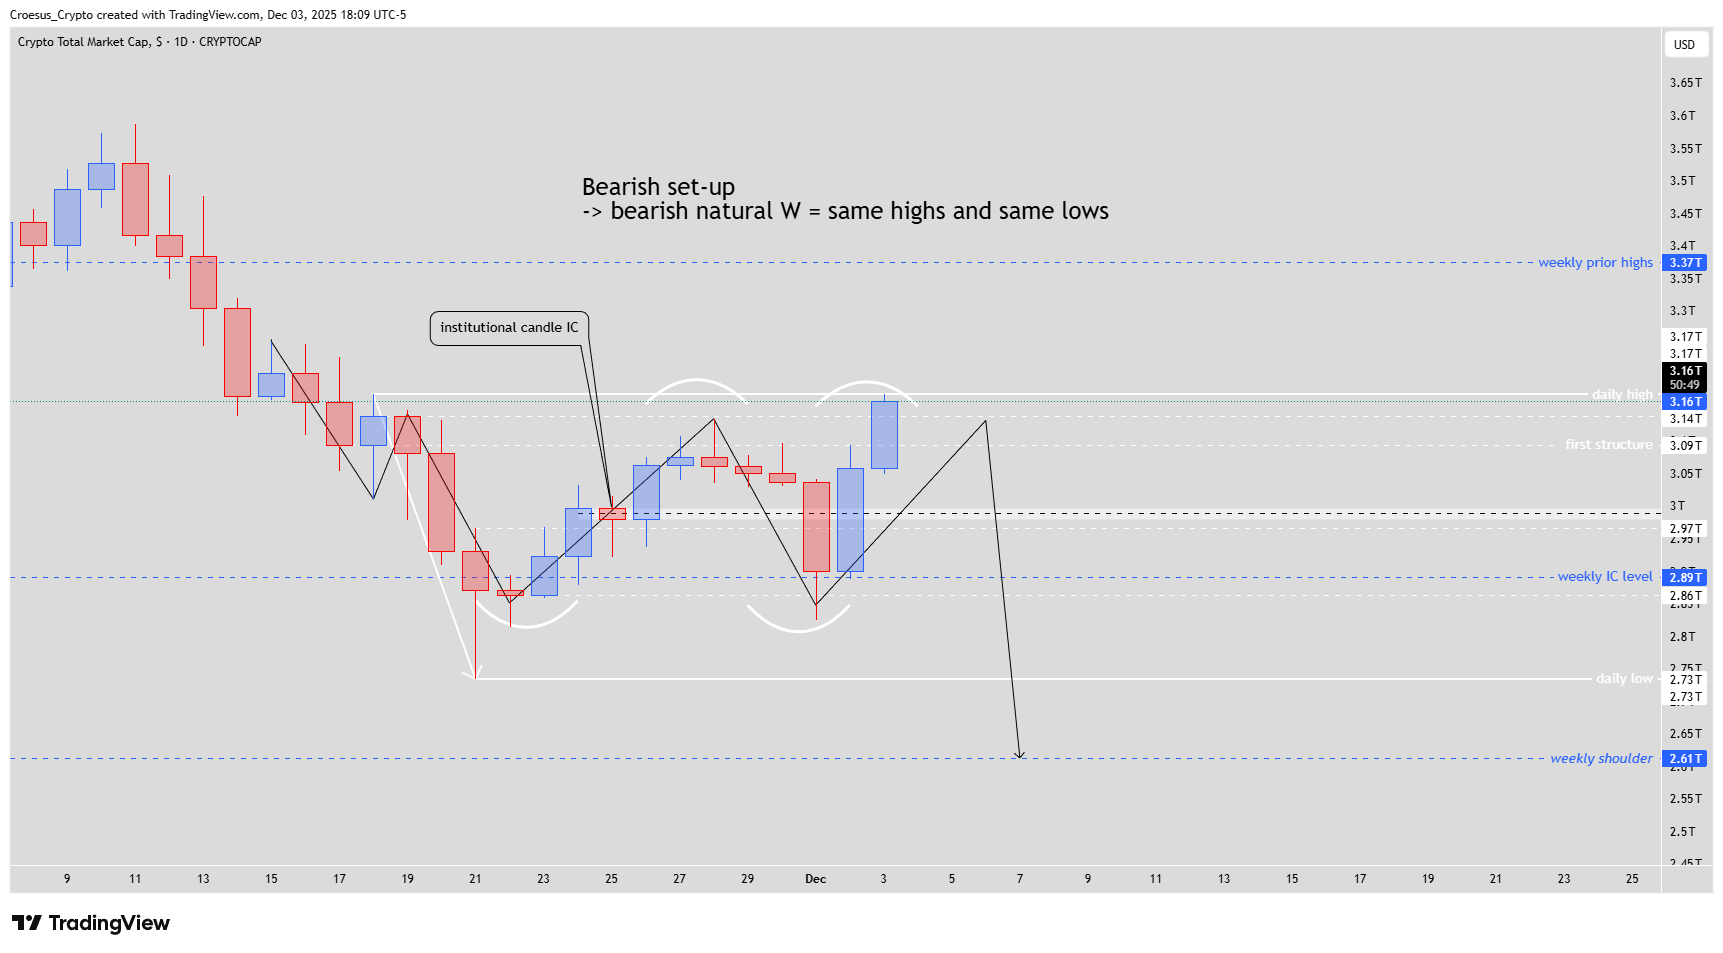
- Bearish = even with a strong momentum, bulls are not able to break the daily entry zone. If we see a reversal, this a typical set-up for a bearish natural W, where, after printing the bearish W, the index printed equal lows and equal highs. This only confirms the strength of the first bearish W.
- We have to remain very cautious. Eventhough we expect a bullish retracement after hitting a weekly level and printing a first bullish candle, the index could still go lower before correcting higher.
Market Structure Analysis
Our TOTAL daily analysis shows price pressing into the daily high after a sharp rejection candle that originated from the IC-zone. As long as this institutional candle area continues to act as support, the market structure allows for an inverse head and shoulder to complete, aligning with our clean support resistance and Fibonacci-based workflow.
Failure to close above the daily high keeps the earlier bearish natural W pattern in control. Equal highs into resistance, combined with prior equal lows, would reinforce the initial bearish W and suggest that current strength is only a corrective rally inside a broader downtrend from the higher timeframe. The weekly IC level and weekly shoulder remain the larger context, reminding us that even a bullish retracement can unfold after one more liquidity sweep to the downside.
Key Levels and Scenarios
Bullish scenario: A decisive daily close above the daily high turns momentum in favor of the bulls. Holding above the IC-zone after any retest would validate the inverse head and shoulder and open continuation towards prior weekly highs, with upside driven by renewed risk appetite across the crypto complex.
Daily high resistance: close above confirms bullish reversal structure.
Daily entry zone: rejection here keeps the bearish natural W valid.
IC-zone support: must hold to complete an inverse head and shoulder.
Weekly IC level: intermediate support where a corrective dip could find buyers.
Weekly shoulder area: deeper bearish target if the W pattern resumes lower.
Trading Implications
For active traders, this technical analysis favors reactive trading: wait for the daily close relative to the high, then look for clean entries on retests of the IC-zone or daily entry zone, with tight invalidation beyond these horizontal levels and position sizes aligned to volatility.
This analysis is for educational purposes only and is not financial advice or a recommendation to buy or sell any asset.