


TOTAL Marketcap / Crypto Total Market Cap
TOTAL timeframe analysis 04 February 2026. The total crypto market cap remains under clear bearish pressure, and our technical analysis continues to show weak follow-through from buyers after a brief attempt at stabilization.
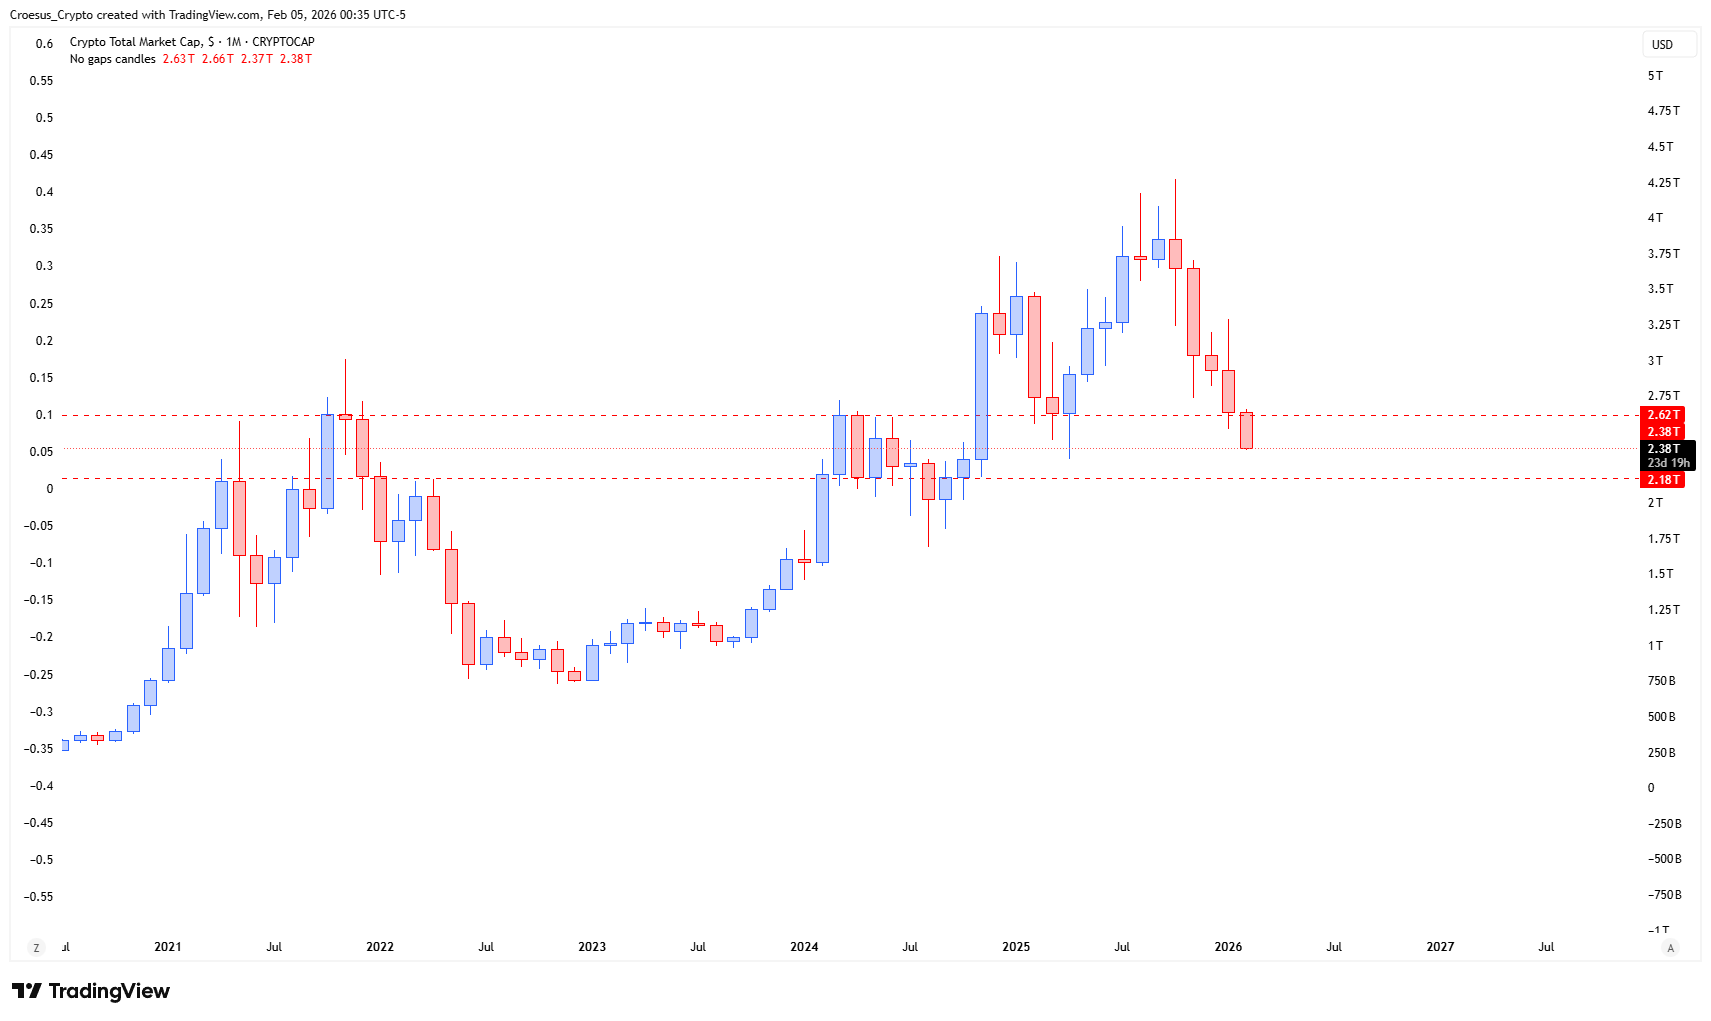
- After a first bullish candle in a long series of bearish candles, we expected some kind of relief rallye.
- But the market still doesn't have any strength, the bears kept on pushing furter south.
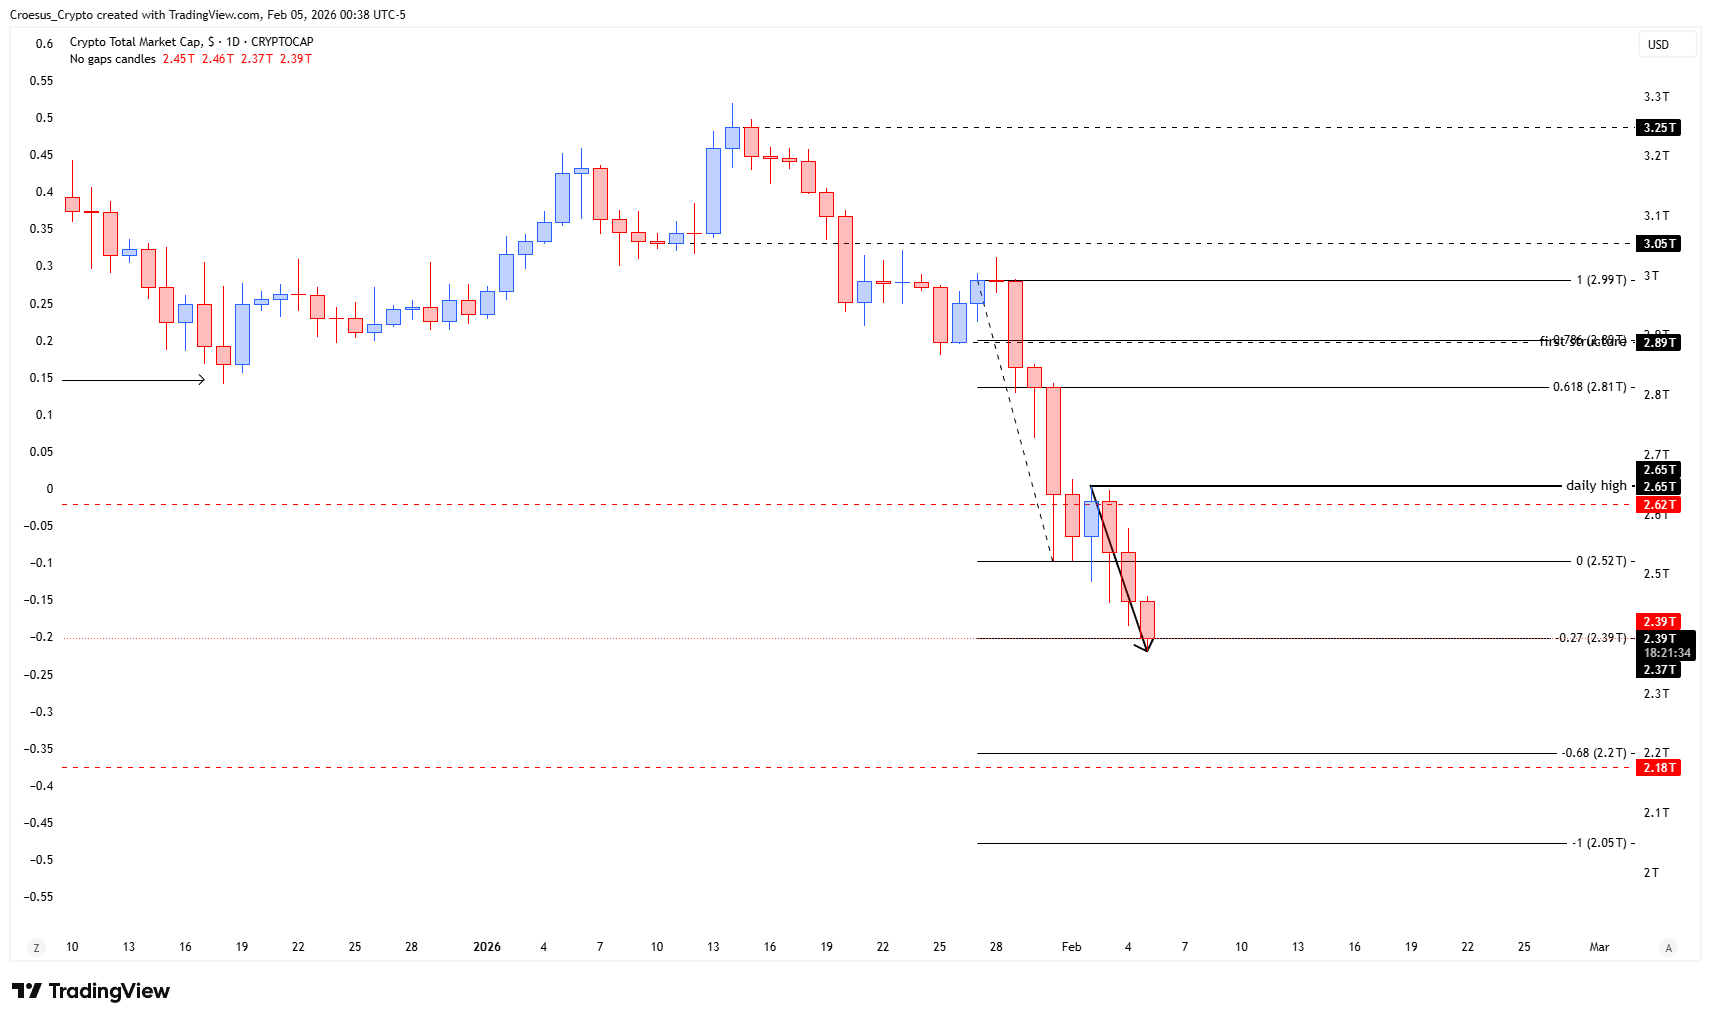
- We are touching the -0.27 fib level at this moment but this doesn't mean anything. Normally it is a level where we could expect some reaction. But we need to see a lower time frame reversal first.
Market Structure Analysis
In this TOTAL timeframe analysis, market structure stays decisively bearish: the sequence of bearish candles signals sustained selling pressure and weak demand at previous support resistance zones. The isolated bullish candle reads more like a short corrective pause (potential relief attempt) than a confirmed reversal, as price fails to build an impulsive move to the upside and instead extends lower again. While the -0.27 Fibonacci level is now being tested and can often act as an area where flows change, it is not a signal by itself. Structurally, we need evidence of a reversal on lower time frames—such as a clear shift in swing structure (higher low / break of structure) or a strong reclaim of a prior horizontal level—before treating this area as more than a temporary pause in a downtrend.
Key Levels and Scenarios
For our TOTAL timeframe analysis, the near-term decision point is whether the market can defend the current Fibonacci area and shift structure, or whether bears keep control and extend the trend.
- -0.27 Fibonacci level: current reaction zone; needs confirmation before it matters
- Recent swing high area: must be reclaimed to suggest a meaningful relief rally structure
- Most recent swing low: loss of this area keeps bearish continuation in play
- Prior support resistance zones overhead: likely supply on any bounce while structure remains bearish
Trading Implications
With structure still bearish, aggressive participants may look for short-term reactions around the Fibonacci area, but the higher-probability approach is waiting for a confirmed lower time frame reversal before expecting a sustained relief rally. Until structure shifts, upside moves are more likely corrective than impulsive.
This analysis is for informational purposes only and does not constitute financial advice.