


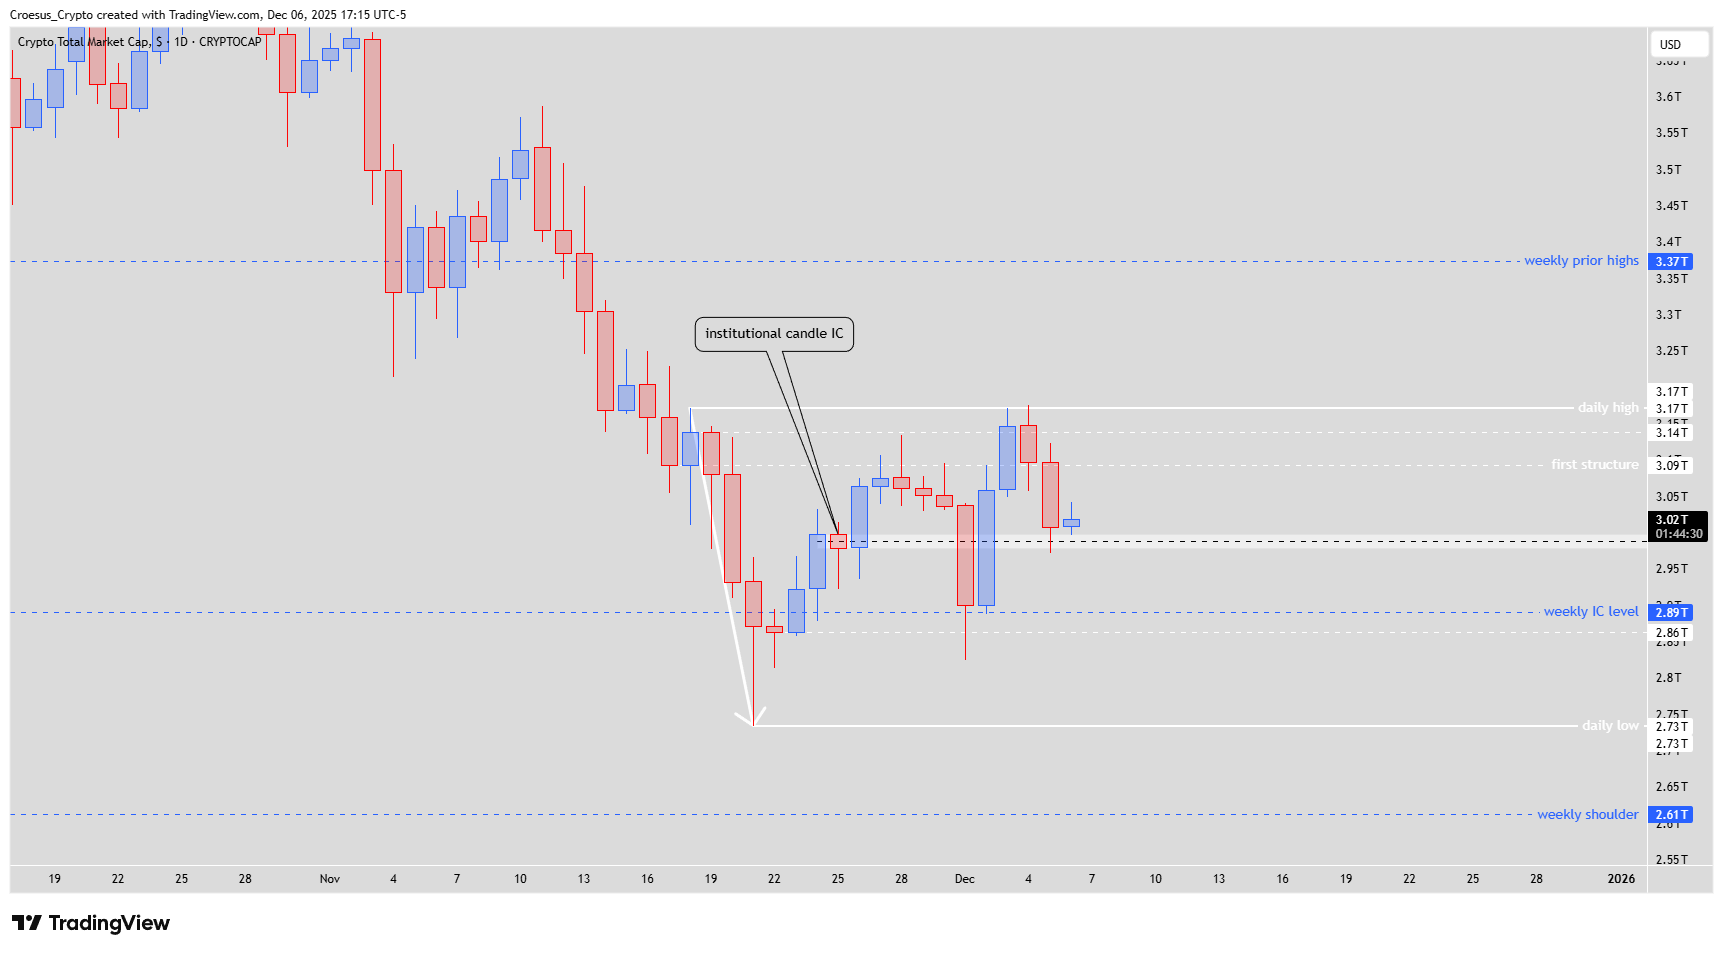
Our TOTAL daily analysis for 06 December 2025 focuses on how the index reacts to the institutional candle (IC) zone, after yesterday’s push down into this support. This technical analysis frames both a potential bullish M reversal and a bearish natural W continuation, depending on how price behaves between the IC-zone and the daily entry area around 3.02T.
TOTAL daily chart 2025-12-06 with institutional candle IC-zone and key support resistance levels
Trend = bearish
Technical Analysis Key Points
- Yesterday the index fell down towards the IC-zone as analyzed. As common this bullrun, the weekend seems to be a calmer period. Retail has a lack of interest or lacks the volume to have any influence on the crypto markets.
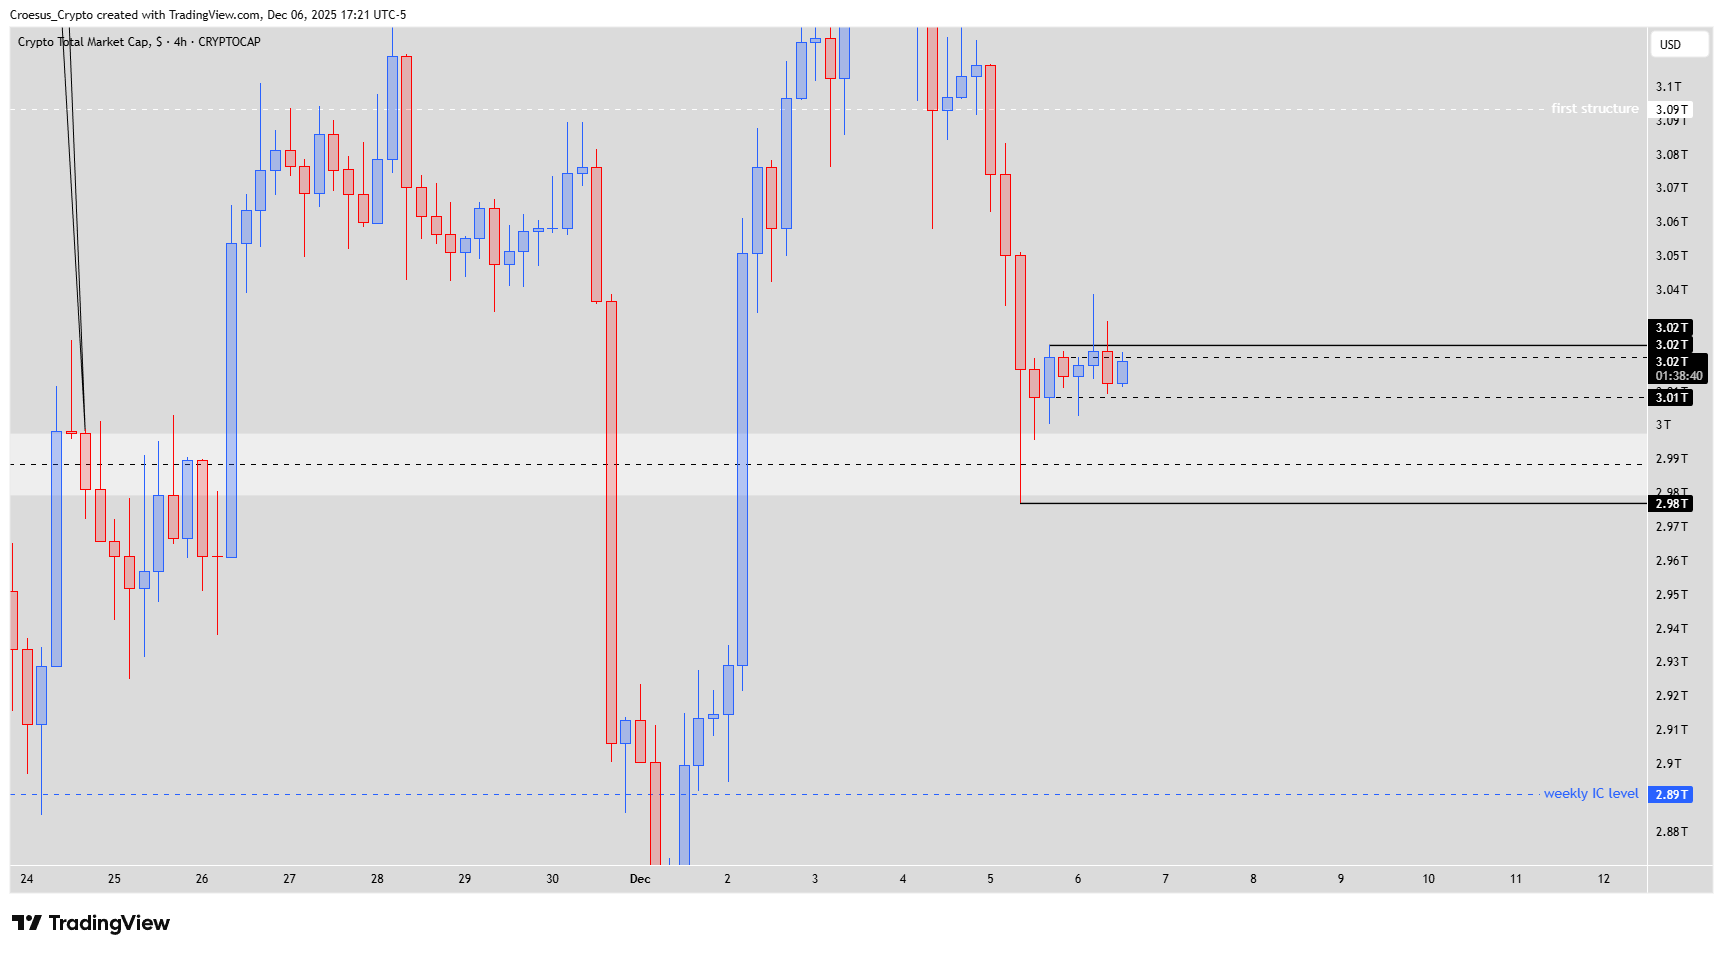
- As indicated before, once the index hit the IC-zone we would look on the lower timeframe 4H for any signs of reversal. We could see one attempt higher and a retest, but the next attempt failed to put a new higher high (internal structure) was rejected. In order to form a clear bullish M, we would like to see a convincing impulsive push up, showing us that the bulls are interested again.
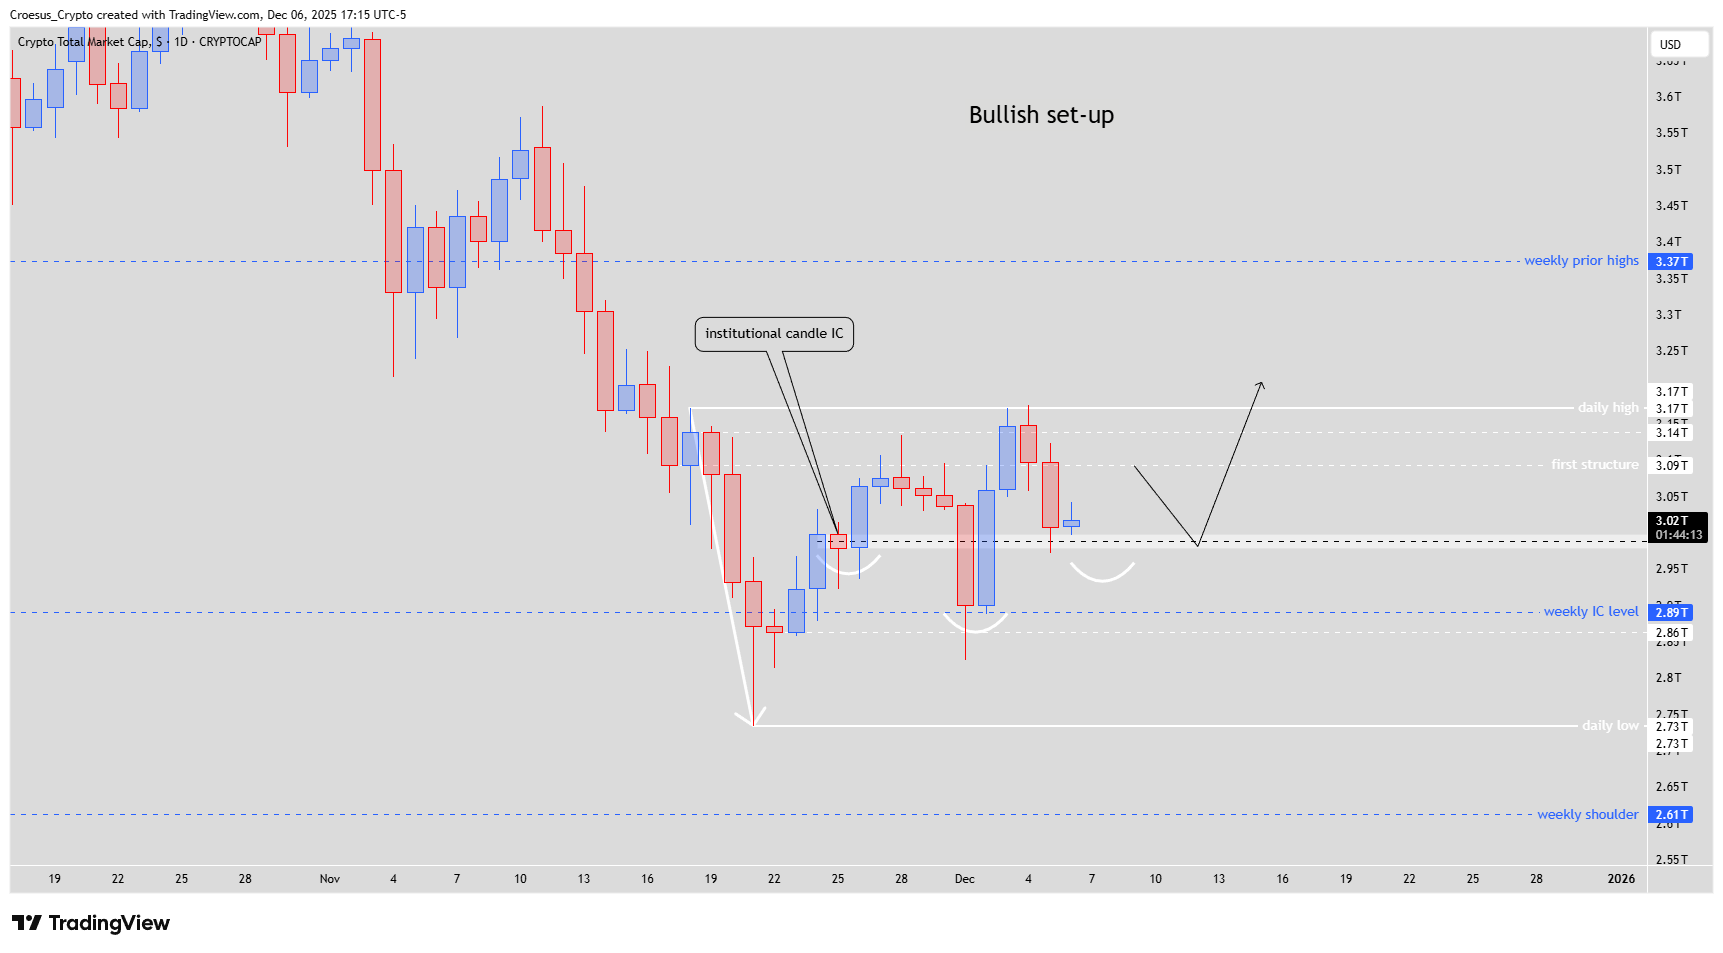
- Bullish = switch of momentum + if the IC-zone holds as strong support zone for a bullish reversal, printing a inverse head and shoulder.
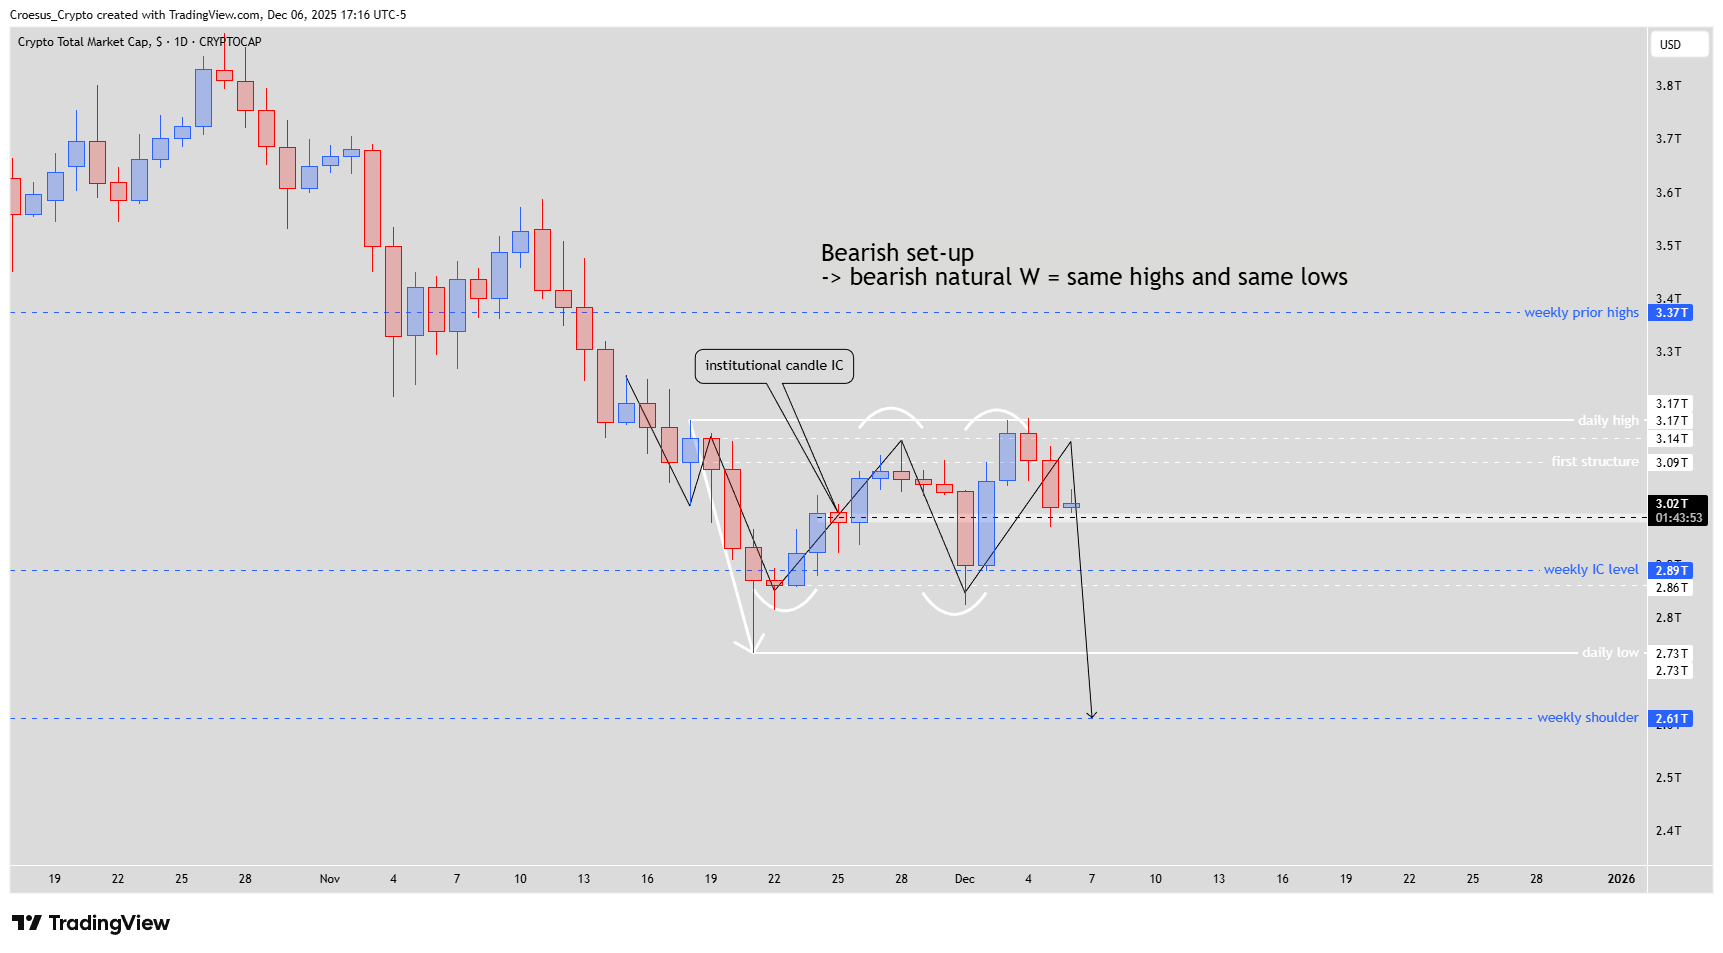
- Bearish = even with a strong momentum, bulls are not able to break the daily entry zone. If we see a reversal, this a typical set-up for a bearish natural W, where, after printing the bearish W, the index printed equal lows and equal highs. This only confirms the strength of the first bearish W.
Market Structure Analysis
From a market-structure perspective, the IC-zone near the weekly IC level (~2.89T) is our key support in this TOTAL daily analysis. Price tapped this zone and showed only a shallow 4H bounce that failed to create a new internal higher high, signalling weak bullish participation so far. A strong impulsive leg up from here would complete a bullish M on the lower timeframe and could turn this IC-zone into a firm support resistance flip.
If, instead, the current bounce stalls below or at the daily entry zone around 3.02T, our technical analysis favours a continuation of the broader downtrend. The bearish natural W, with equal highs and equal lows, underlines distribution and supports the idea of another leg down once liquidity above local highs is cleared. Traders may align these zones with their own Fibonacci retracements, but the core signal remains the pattern and reaction to the IC-zone.
Key Levels and Scenarios
Bullish scenario:
A decisive momentum switch from the IC-zone, with a clear impulsive push that breaks and holds above the 3.02T daily entry zone and then 3.09T first structure. This would validate an inverse head and shoulders and open room toward the 3.17T daily high and possibly the 3.37T weekly prior highs (roughly 5–12% upside from 3.02T).
Bearish scenario:
Failure to reclaim 3.02T and a reversal pattern forming a bearish natural W would confirm seller control. In that case, continuation down toward the 2.73T daily low and 2.61T weekly shoulder implies roughly 10–14% downside from current levels.
Key levels to watch
3.37T – weekly prior highs: Major resistance; bullish target if structure fully reverses.
3.17T – daily high: Intermediate resistance on any upside move.
3.09T – first structure: Structural pivot; reclaiming it strengthens the bullish case.
3.02T – daily entry zone: Line in the sand between bullish M and bearish W outcomes.
2.89T – weekly IC level (IC-zone): Primary support; loss of this opens path toward 2.73T–2.61
Trading Implications
For now, we see a binary setup: aggressive longs only if a clear momentum shift appears from the IC-zone with stops below 2.89T, while shorts favour rejection at or below 3.02T with downside targets toward 2.73T and 2.61T and position sizes adjusted to volatility.
This analysis is for educational purposes only and does not constitute financial advice.