


TOTAL daily analysis for 06 January 2026 starts with the yearly picture: the crypto total market cap is trading almost exactly where it opened 2025, around 3.18T, while pressing into prior weekly lows acting as resistance. This technical analysis focuses on how that yearly and weekly context interacts with the recent 6-day impulsive rally and what that means for near-term support resistance dynamics and potential Fibonacci retracement targets.
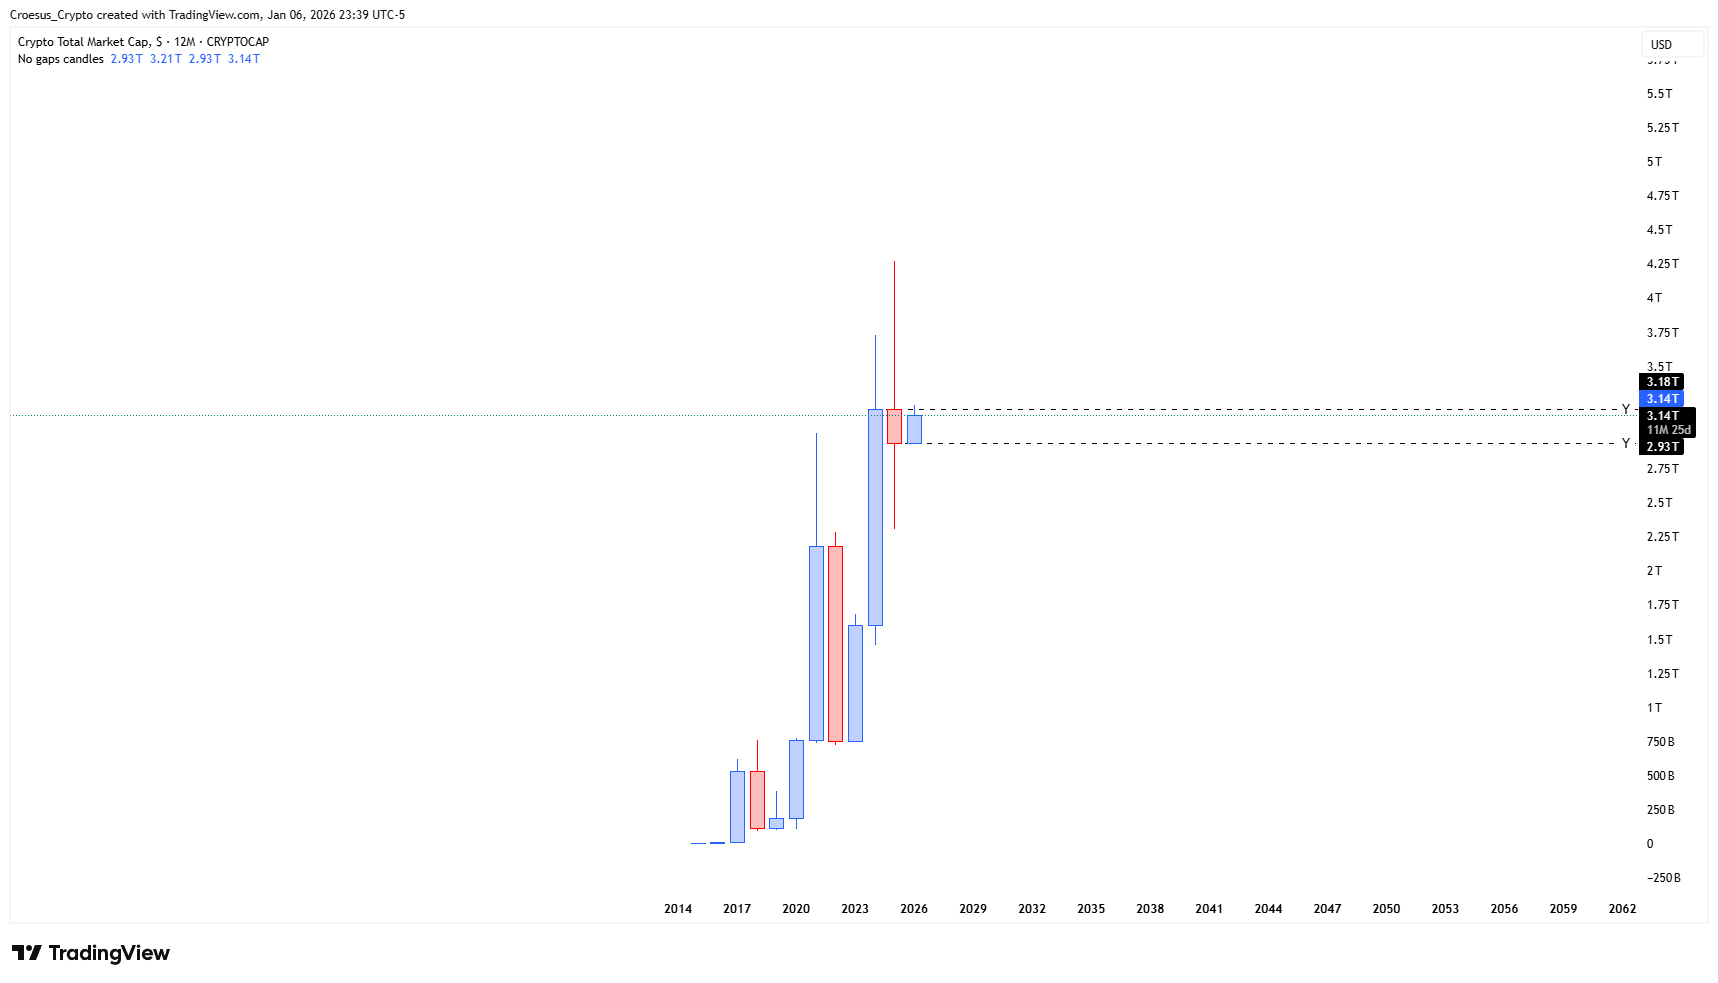
TOTAL yearly chart 06 January 2026 with price returning to 3.18T yearly open and resistance band.
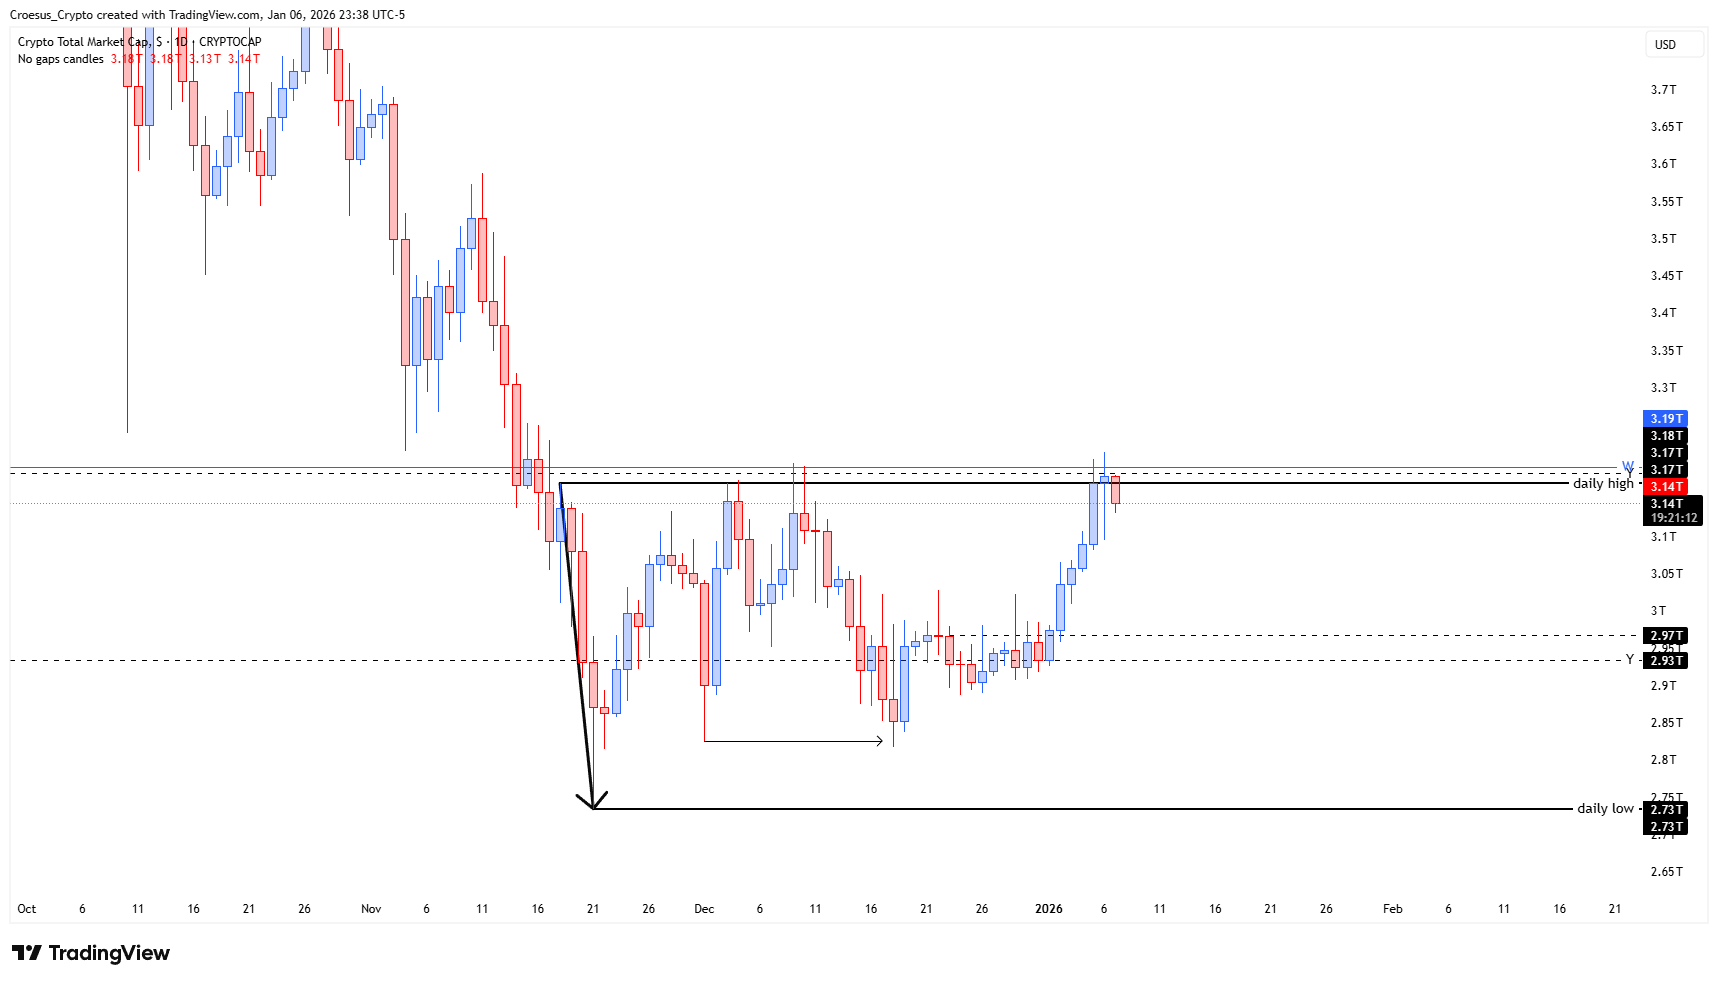
TOTAL daily chart 06 January 2026 with impulsive 6-day rally from yearly low into prior weekly support-turned-resistance.
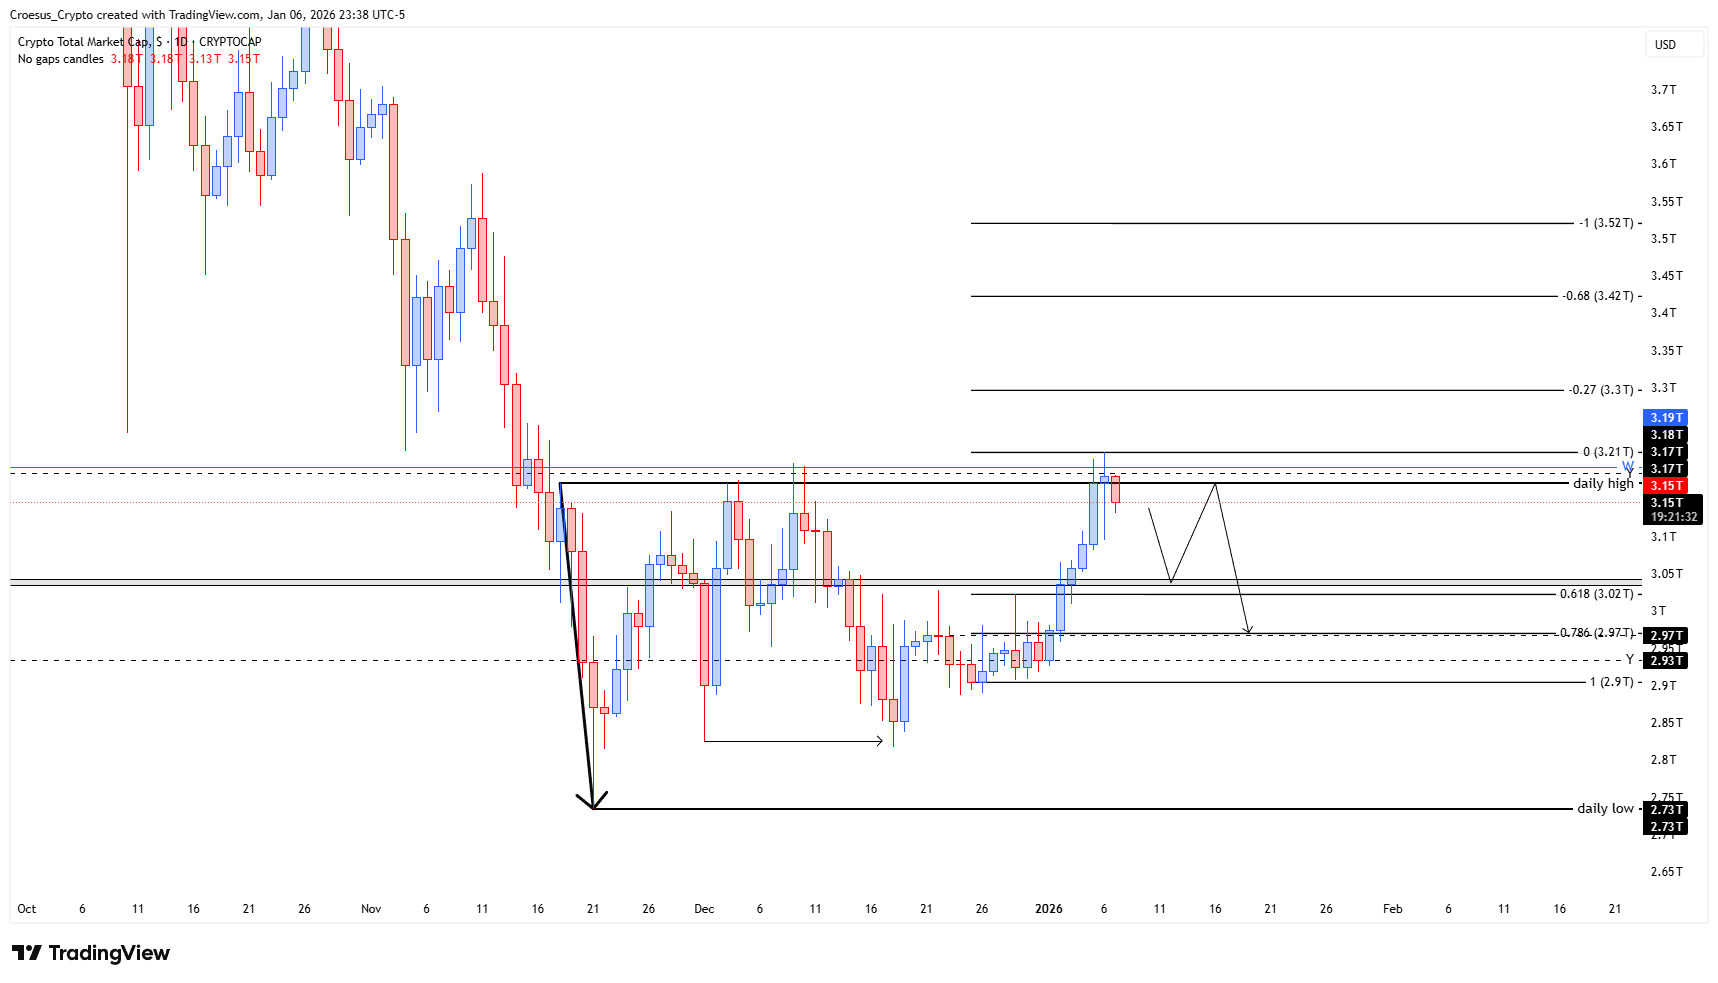
TOTAL daily chart 06 January 2026 with Fibonacci retracement, 0.786 at 2.97T, and projected ABC corrective structure.
Technical analysis
- we just had the start of a new year. It is interesting to see where we are on a yearly level.
- If we take the yearly chart we are back at the same level where we opened at the beginning of 2025 (3.18 T)
- We can also see that we are agains a key weekly level (blue line)(prior lows).
- When we look at the daily chart, we can see an impulsive move up from the Y low to the Y high in one straight move up. 6 daily candles to cover 1 complete yearly candle. As if 2025 did not exist.
- The index touched the Y high but never closed above it. It did however close above the Daily high. Disregard the last candle as this one is not closed yet.
- Bearish case : Is this a fake out ? One touch above the daily high, pulling back within the range on the following day ? Misleading the bulls ?
- Bullish case : after a push up of 6 consecutive days, we could expect some relief. If we take a fibonacci retracement of the last bullish leg, we can see that we get a confluence at the level of fib 0.786 (2.97T) with the first structure. A relief towards that level can be expected. As it is quite an impulsive move, we might expect an ABC correction.
Market Structure Analysis
From a market structure perspective, TOTAL is retesting a cluster of resistance: the yearly open / “Y high” area near 3.18T and prior weekly lows. This is a classic support-turned-resistance zone, making this region highly sensitive for direction in this TOTAL daily analysis. The straight 6-candle rally from the yearly low to that zone shows strong momentum but also leaves very little structure in between, which typically invites mean-reversion.
On the daily chart, the index wicked through the daily high but failed to close above the yearly high, suggesting supply is active here and raising the question of a short-term bull trap. Our technical analysis therefore treats this as an inflection point: acceptance above 3.18T would reopen the path to higher yearly ranges, while rejection favors a corrective leg lower before any sustainable continuation.
Key Levels and Scenarios
Bullish scenario:
If price holds above the broken daily high and converts the 3.17T–3.18T band into support, buyers can attempt continuation toward the next yearly resistance zones. A shallow retrace that stays above the mid-range would keep the impulse intact.
Bearish / corrective scenario:
Failure to hold above the daily high and a decisive move back inside the prior range opens room for a deeper Fibonacci retracement of the last leg. The confluence between structure and the 0.786 level at 2.97T is a logical magnet for an ABC-type correction before assessing fresh demand.
Key levels to watch :
3.18T yearly open / Y high: Major resistance and pivot for broader trend acceptance or rejection.
3.17T daily high zone: Short-term line in the sand for bulls; rejection favors range re-entry.
3.02T (approx. 0.618 Fib): Intermediate support where a first reaction may appear in a controlled pullback.
2.97T (0.786 Fib + first structure): High-confluence support; key downside target for a full ABC correction.
~2.73T prior daily low: Deeper support; loss of this level would shift the narrative from correction to potential trend reversal.
Trading Implications
For active traders, this TOTAL daily analysis suggests asymmetric short-term risk: reward favors waiting for either a cleaner rejection from 3.18T to target 2.97T, or a confirmed reclaim and hold above the yearly open before considering trend-following longs, always sizing positions conservatively around these volatile inflection zones.
This is not financial advice; always do your own research and manage risk accordingly. The structure of this analysis follows our internal trade plan framework