


In this TOTAL daily analysis for 07 January 2026, we focus on how the market reacts after a failed breakout above key resistance. Our technical analysis highlights the rejection at the weekly level and yearly high, and the index now trading back inside a well-defined 47-day range.
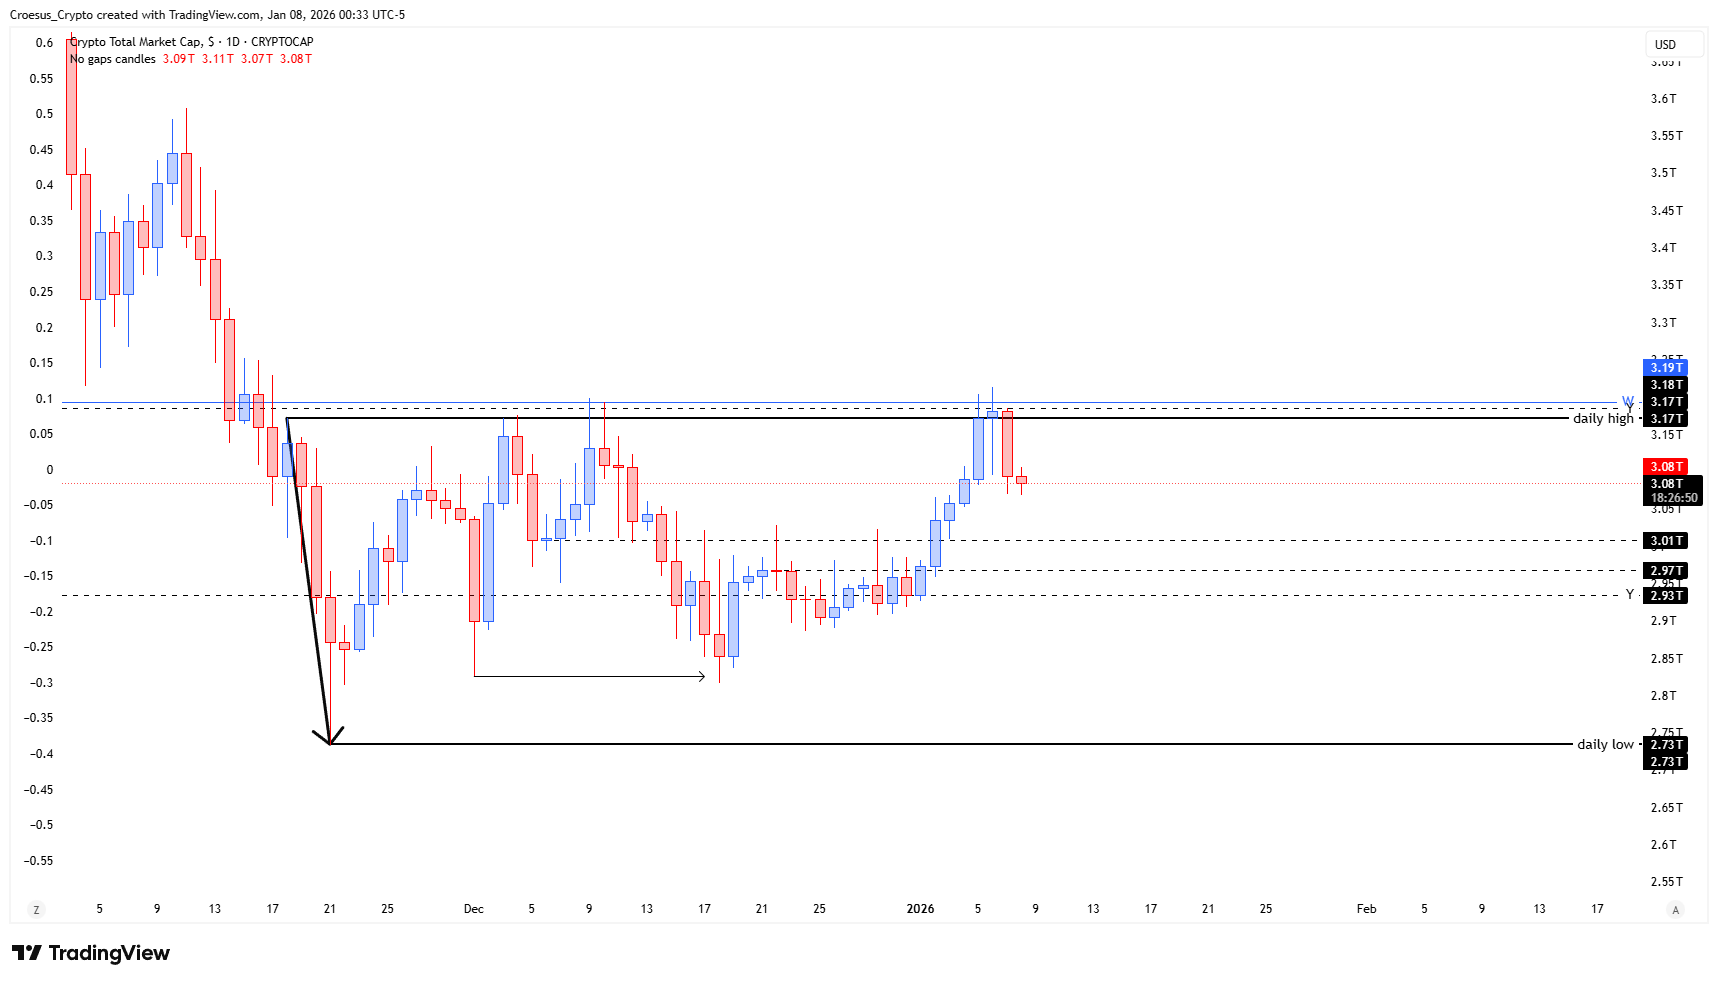
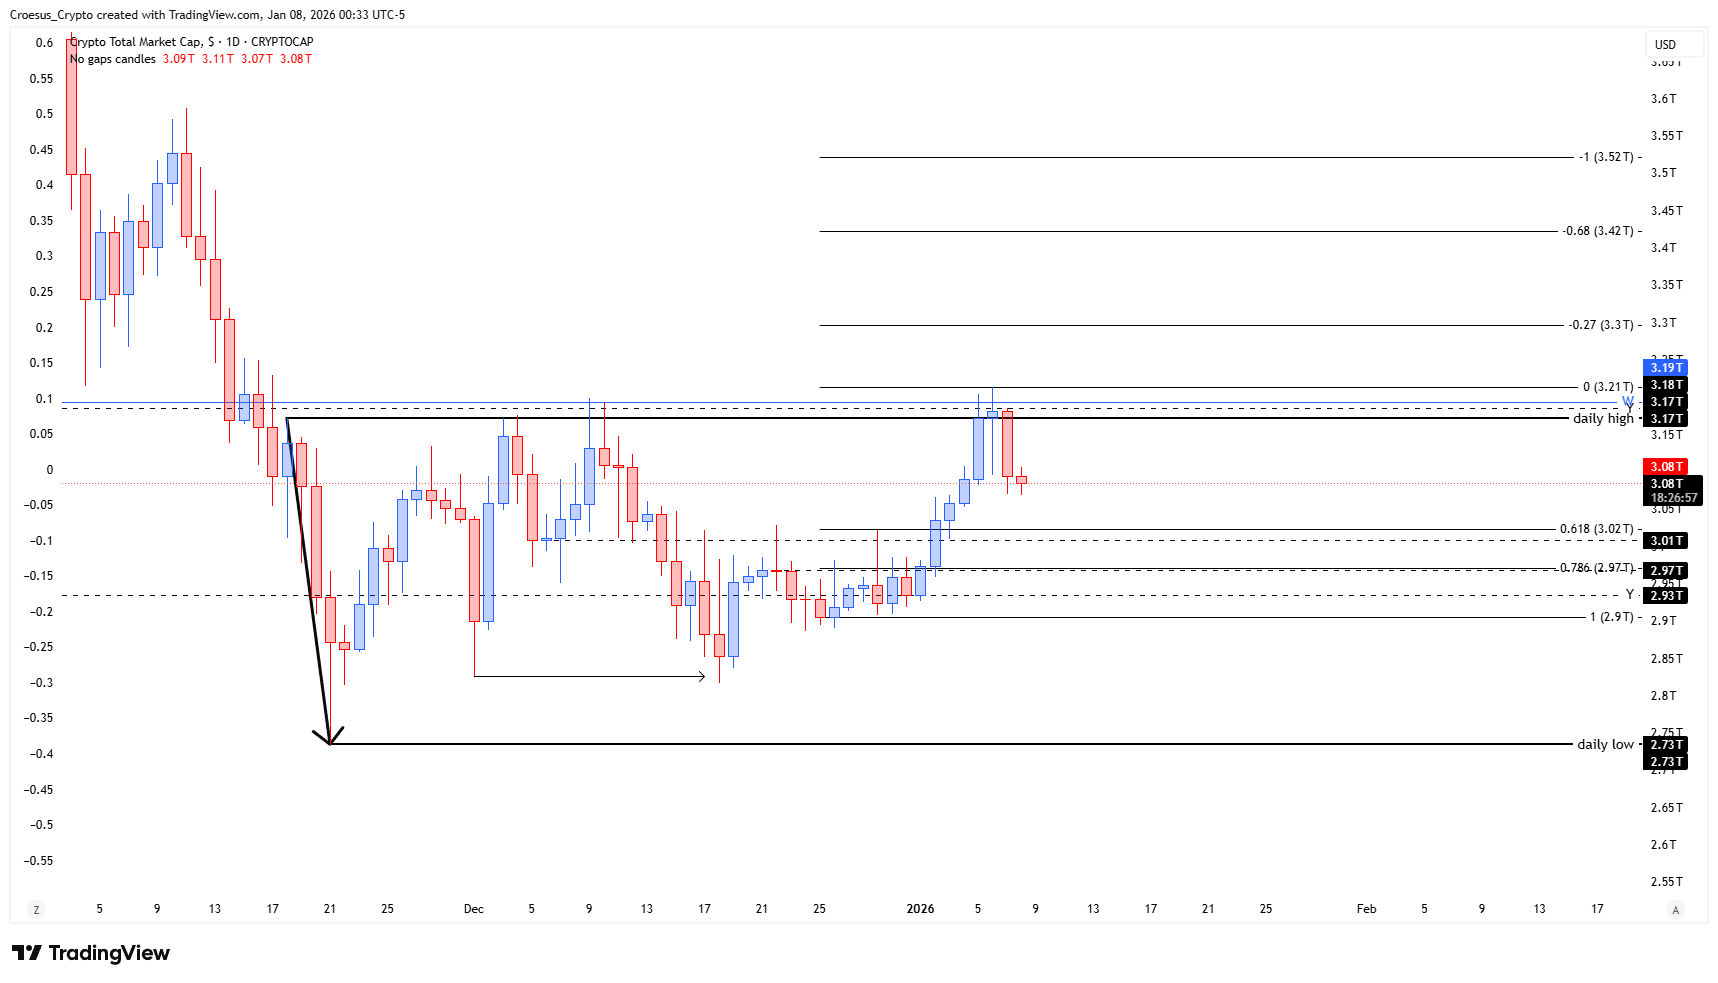
TOTAL daily chart 7 January 2026 with 47-day range, rejection at weekly/yearly high, and highlighted daily high/low levels.
Technical analysis
- After the minor break of the daily high we saw a clear switch of momentum and rejection at the weekly level and yearly high.
- The index is trading back in the daily range that maintains respected for 47 days now.
- At this moment we are looking at a bullish impulse of 7 consecutive days. This bearish move could be considered as an ABC correction.
Market Structure Analysis
Our TOTAL daily analysis shows that the brief push above the daily high into the weekly/yearly resistance cluster around 3.21T was quickly rejected, signalling exhaustion of the short-term move. Price rotated back inside the established daily range between roughly 2.73T (range low / prior daily low) and 3.17T (range high / daily high), confirming this zone as a dominant support resistance area.
The current downswing unfolds after a 7-day impulsive advance and fits the structure of an emerging ABC correction within that broader bullish leg. With the index now pulling back from the upper boundary of the range, we monitor whether buyers defend intermediate supports and Fibonacci retracements near 3.01T and 2.93T, which align with prior consolidation and intraday structure.
Key Levels and Scenarios
Bullish scenario: if the ABC correction terminates above the 2.93T–3.01T support band and price reclaims 3.17T, the path opens for another test of the 3.21T weekly/yearly high and potentially higher Fibonacci extension targets.
Critical levels to watch:
3.21T – Weekly + yearly high, major resistance and rejection point.
3.17T – Daily range high; reclaiming it would confirm renewed bullish momentum.
3.01T – Local support and approximate 0.618 Fibonacci retracement of the latest impulse.
2.93T – Deeper support / Fibonacci confluence inside the range.
2.73T – Daily range low; loss of this level would invalidate the bullish corrective view.
Trading Implications
For active traders, the 2.93T–3.01T zone offers the clearest area to assess long setups with tight invalidation below 2.73T, while shorts are only attractive on fresh rejection signals back near 3.17T–3.21T; position sizing should respect the full width of the range and individual risk limits.
This is not financial advice; always do your own research and manage risk accordingly. The structure of this analysis follows our internal trade plan framework