


In this TOTAL daily analysis for 08 December 2025, we focus on how the recent bounce from the institutional candle (IC) level interacts with a still-dominant bearish trend and two opposing head and shoulders structures. Our technical analysis frames both bullish and bearish scenarios while price trades in a noisy range.
Technical analysis
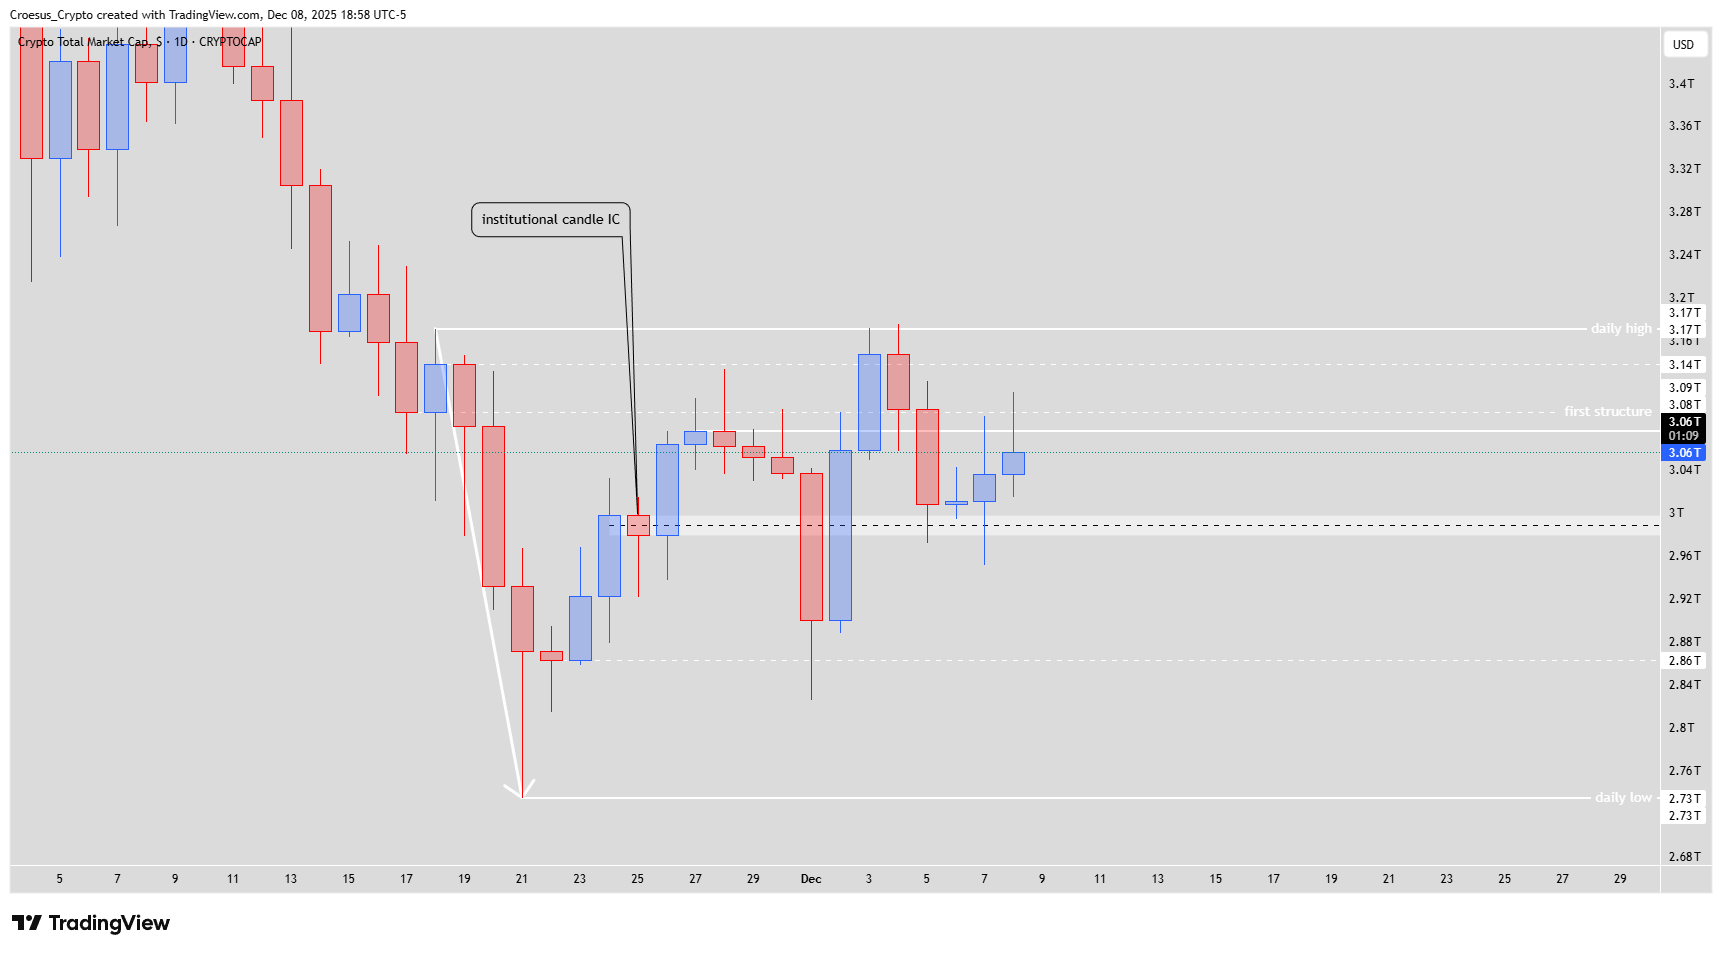
- Yesterday we saw a bullish reaction on the IC level, followed today with a second bullish candle.
- We were looking at the IC as a level of support for a bullish move up. But what if we wanted to go bullish too much ?
- The predominant trend is still bearish.
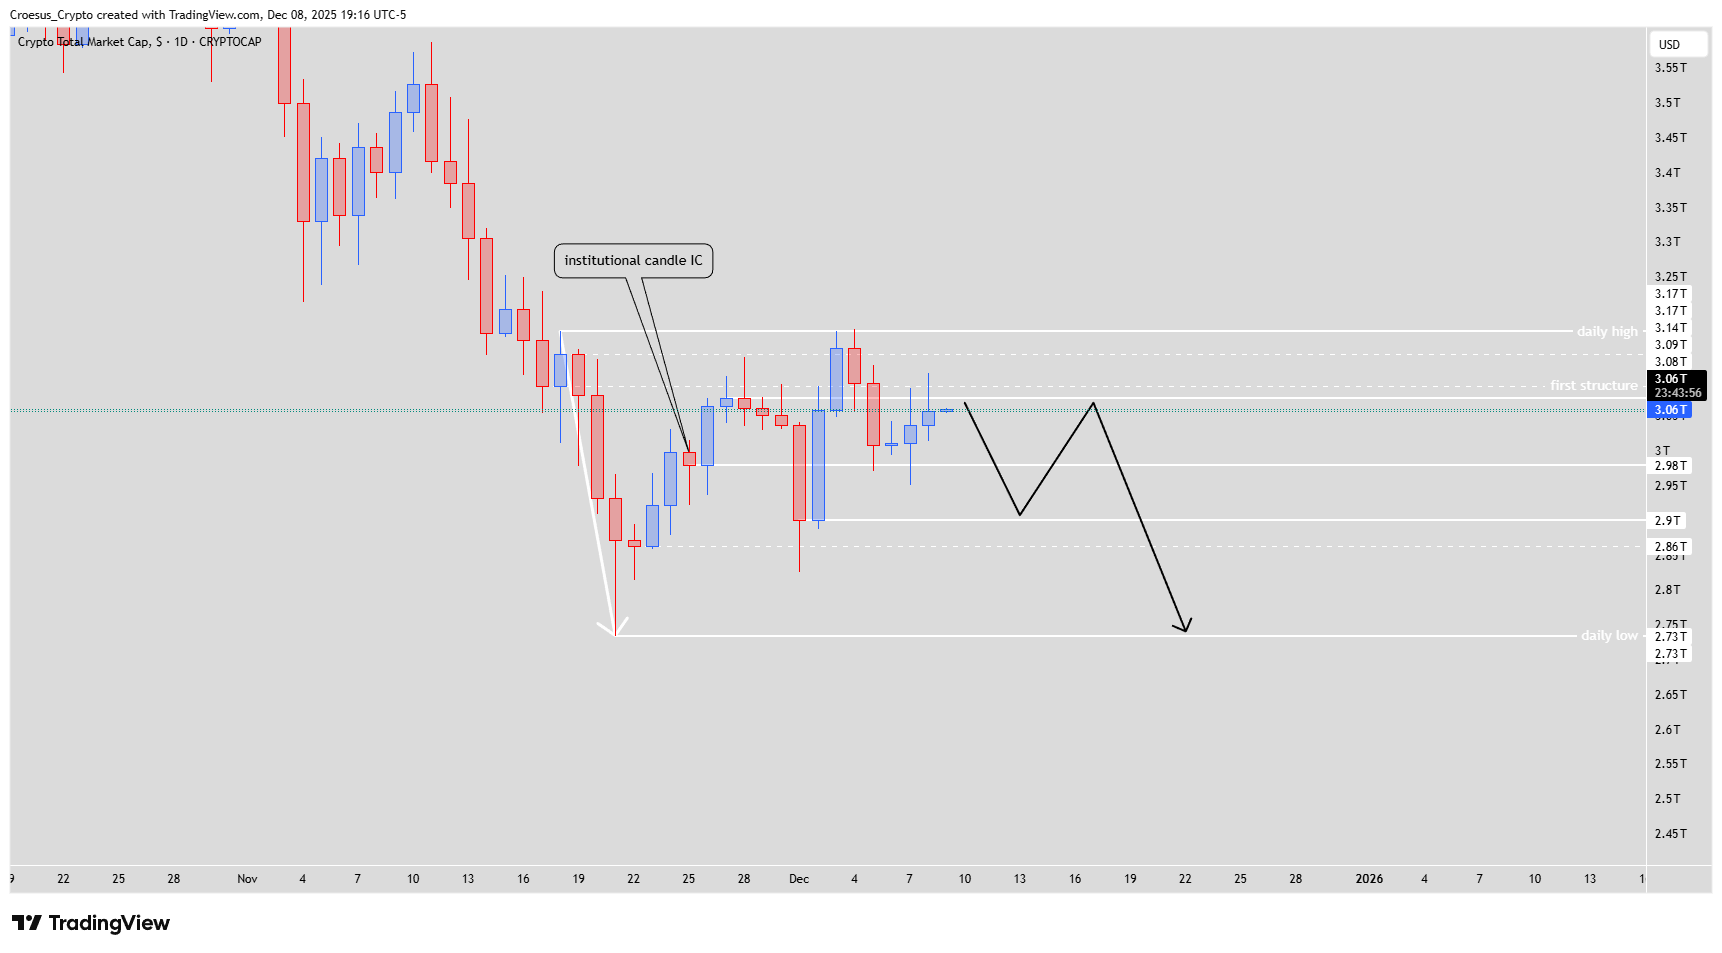
- What if we have printed the start of a head and shoulders with the shoulders @ 3.08T, the zone we retested for the second time now but couldn't break yet.
- Even a double top would keep the head and shoulders pattern valid.
- The game of marketmakers is tricking people. We are still in a bearish trend, everything within this range is still noise.
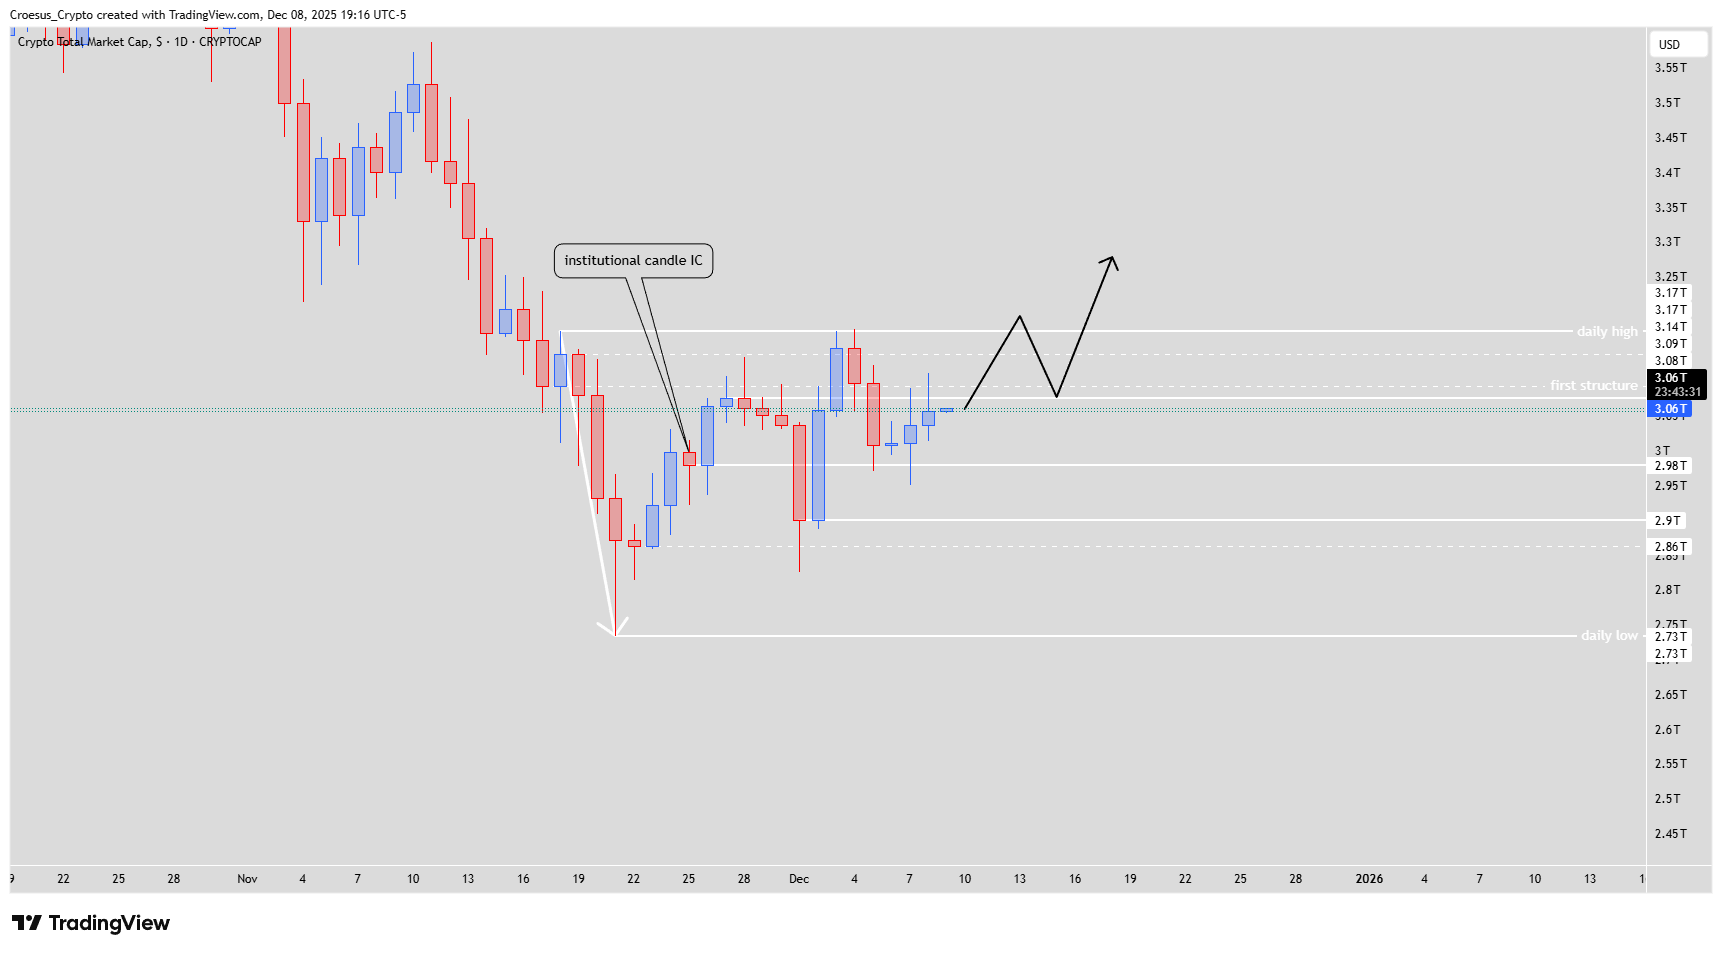
- If our bias is bullish we can see a potential inverse head and shoulder set-up with the head @ 2.9T and the shoulder @2.98T
- But if your bias is bearish, confluent with the actual trend, we can see a potential head and shoulder, with the head @ 3.17T (=daily high) and the shoulder @ 3.08T
Market Structure Analysis
Our TOTAL daily analysis shows price reacting cleanly to the IC, confirming it as short-term support, yet the broader structure remains in a series of lower highs and lower lows.
Market makers can exploit this by encouraging early bullish positioning inside the range while the main trend stays down.
A potential head and shoulders forms with a head around the 3.17T daily high and shoulders near 3.08T; even a double top at 3.08T keeps this pattern valid and would reinforce resistance in that zone.
On the other hand, if buyers defend 2.9T–2.98T, an inverse head and shoulders could emerge, giving a clear support–resistance framework without strong Fibonacci confluence visible yet.
Key Levels and Scenarios
Key levels to watch:
3.17T – Daily high and potential “head” of the bearish H&S, major resistance.
3.08T – Rejected twice; key shoulder / first structure resistance.
2.98T – Potential right shoulder of the inverse H&S, first strong support.
2.9T – Possible “head” of the inverse H&S; loss of this level revalidates the bearish trend.
2.73T area – Prior daily low zone where a deeper flush could target next if breakdown accelerates.
Trading Implications
As long as TOTAL trades below 3.08T, we treat rallies as opportunities to manage risk in line with the bearish trend, with tight invalidation above that resistance and cautious sizing until either the bearish or inverse head and shoulders confirms.
This analysis is for educational purposes only and does not constitute financial advice.