


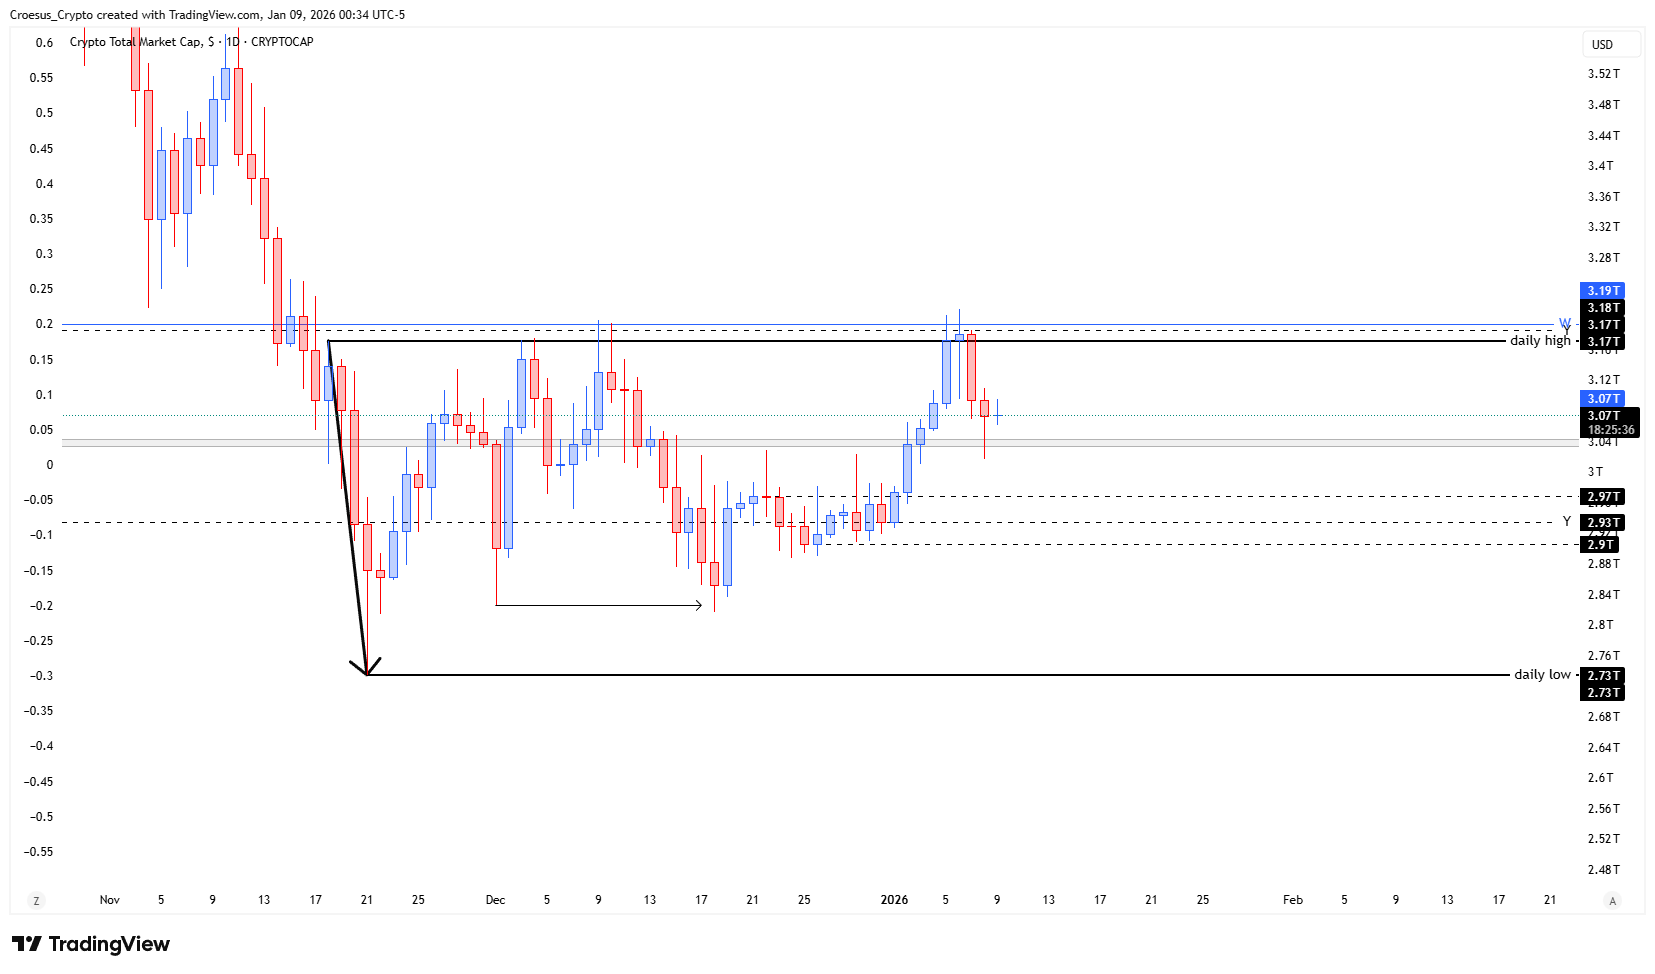
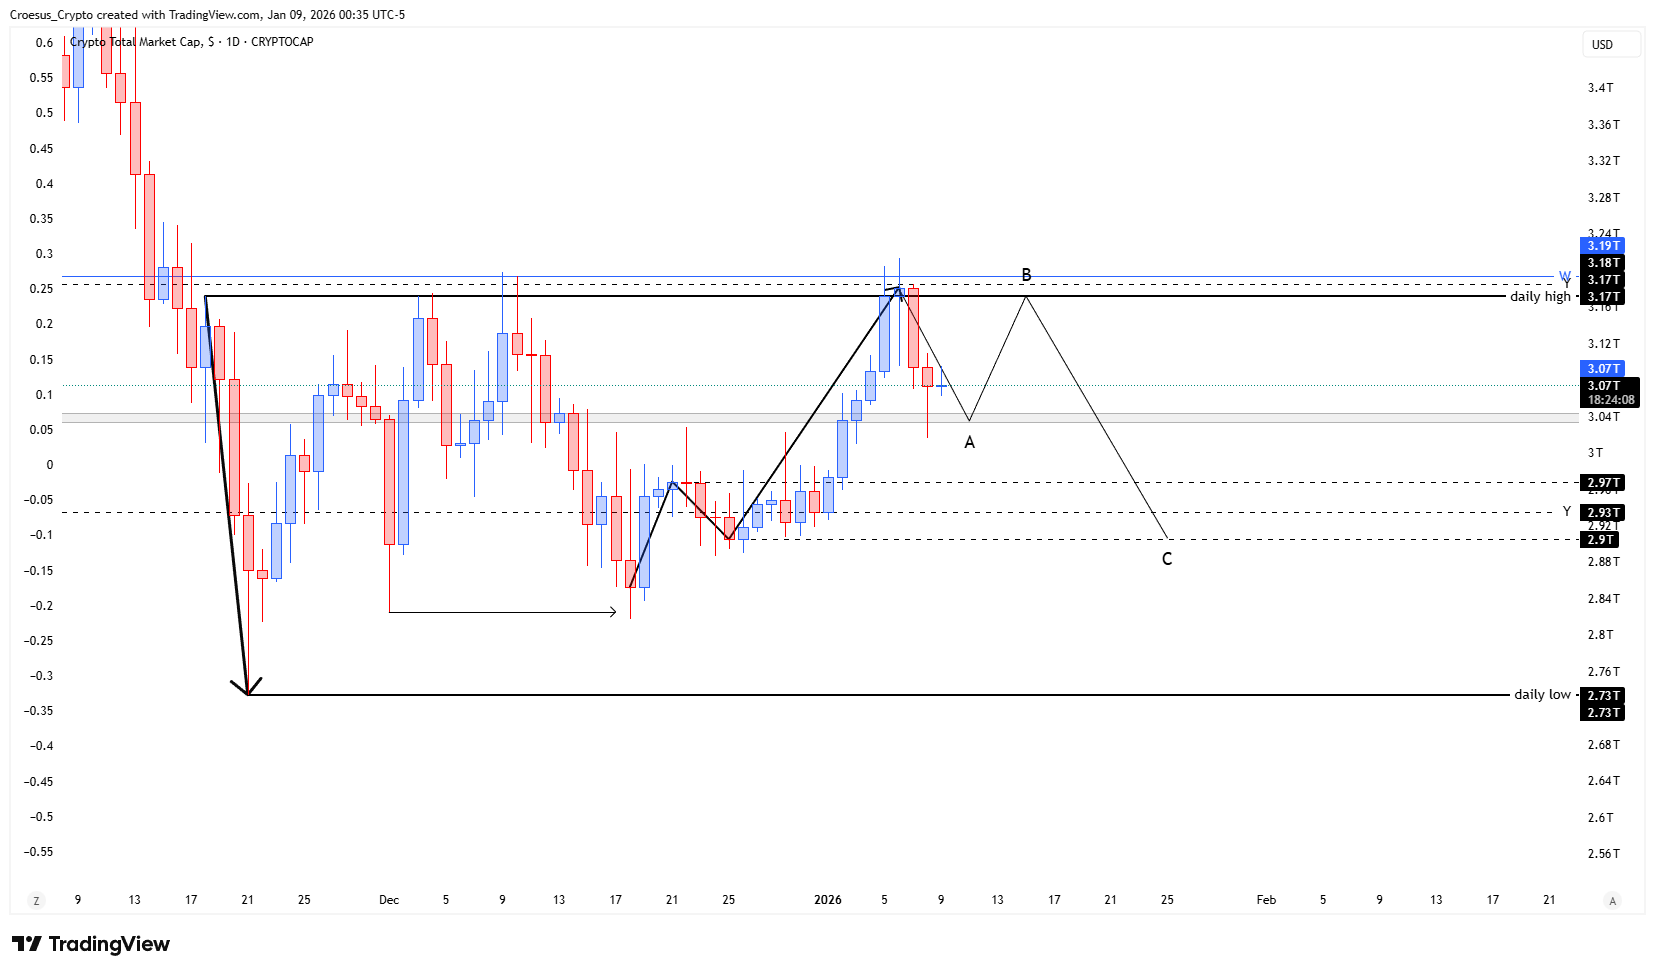
In this TOTAL daily analysis for 08 January 2026, we see the market starting a correction of the strong bullish impulse that kicked off in the first week of the year. Price has rejected the local daily high area and is now likely unfolding an ABC corrective structure within the broader uptrend. This fits our “naked chart” technical analysis approach focused on clean structure and support resistance levels.
OTAL daily chart 9 January 2026 with projected ABC correction and 2.97T–2.90T support target zone.
Technical analysis
- As indicated yesterday the index has started the correction of the bullish impulse up that started in the first week of this year.
- We could see a retest of the highs. This move would fit in the set-up of an ABC correction .
- At this moment our C-target is the zone between 2.97T (first structure) and 2.9T (fib 100% retracement). And coincidentally, the yearly is smack in the middle of that zone.
Market Structure Analysis
Our TOTAL daily analysis shows an initial impulsive rally followed by a first leg down (A), which confirms that buyers are taking profits at resistance near the recent daily high. A potential B-leg retest of those highs would be classic corrective price action before a deeper C-leg develops.
The key structural idea: as long as TOTAL fails to close decisively above the recent high, the ABC correction scenario remains valid. The projected C-leg targets the 2.97T “first structure” support and extends towards the 2.90T Fibonacci 100% retracement, creating a strong demand zone with confluence from the yearly level sitting in the middle of that band. This zone is where we expect responsive buyers if the broader bullish trend is intact.
Key Levels and Scenarios
Key Levels and Scenarios
Bullish scenario: A clean reclaim and acceptance above the recent daily high would invalidate or delay the ABC completion and reopen upside towards the prior swing zone above 3.2T.
Key levels to watch:
3.17T–3.19T: Daily high resistance; failure here supports the ABC correction view.
3.07T–3.12T: Local intraday structure; pivot area for short-term bias.
3.00T: Psychological round number and interim support.
2.97T: First structure support and initial C-leg objective.
2.90T area: Fibonacci 100% retracement and yearly level confluence; major decision zone.
Trading Implications
For active traders, the 2.93T–3.01T zone offers the clearest area to assess long setups with tight invalidation below 2.73T, while shorts are only attractive on fresh rejection signals back near 3.17T–3.21T; position sizing should respect the full width of the range and individual risk limits.
This is not financial advice; always do your own research and manage risk accordingly. The structure of this analysis follows our internal trade plan framework