


TOTAL Marketcap / Crypto Total Market Cap
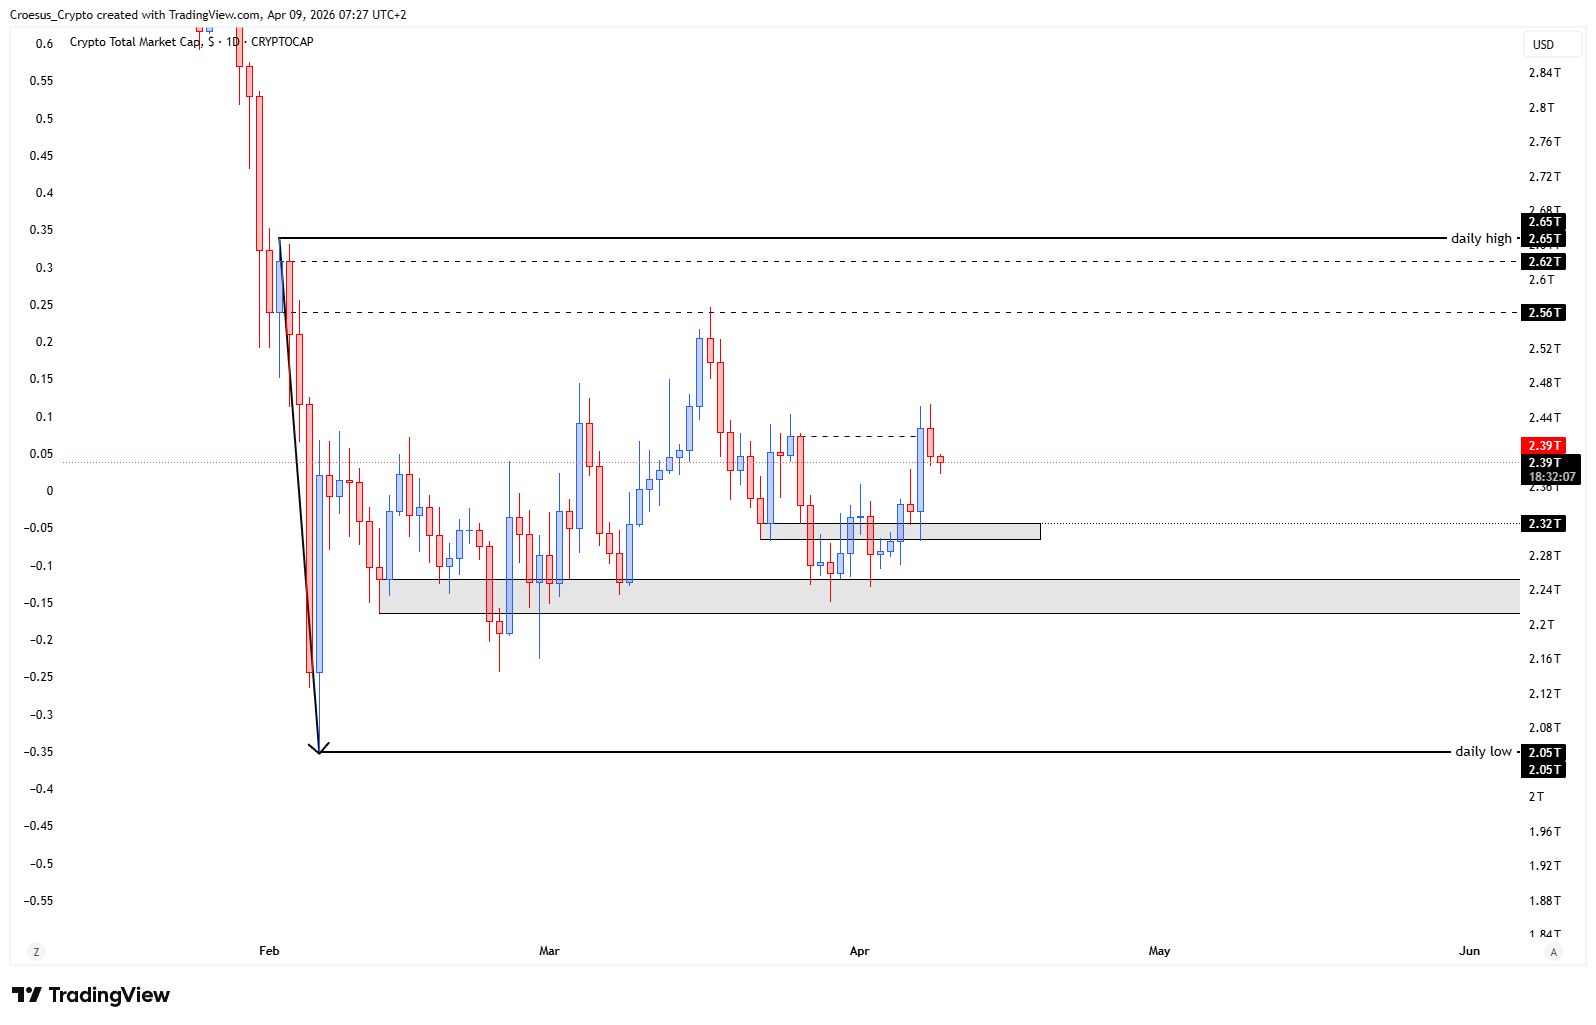
- The index shows us that the index is taking some relief after a significant push up, showing us a switch of momentum.
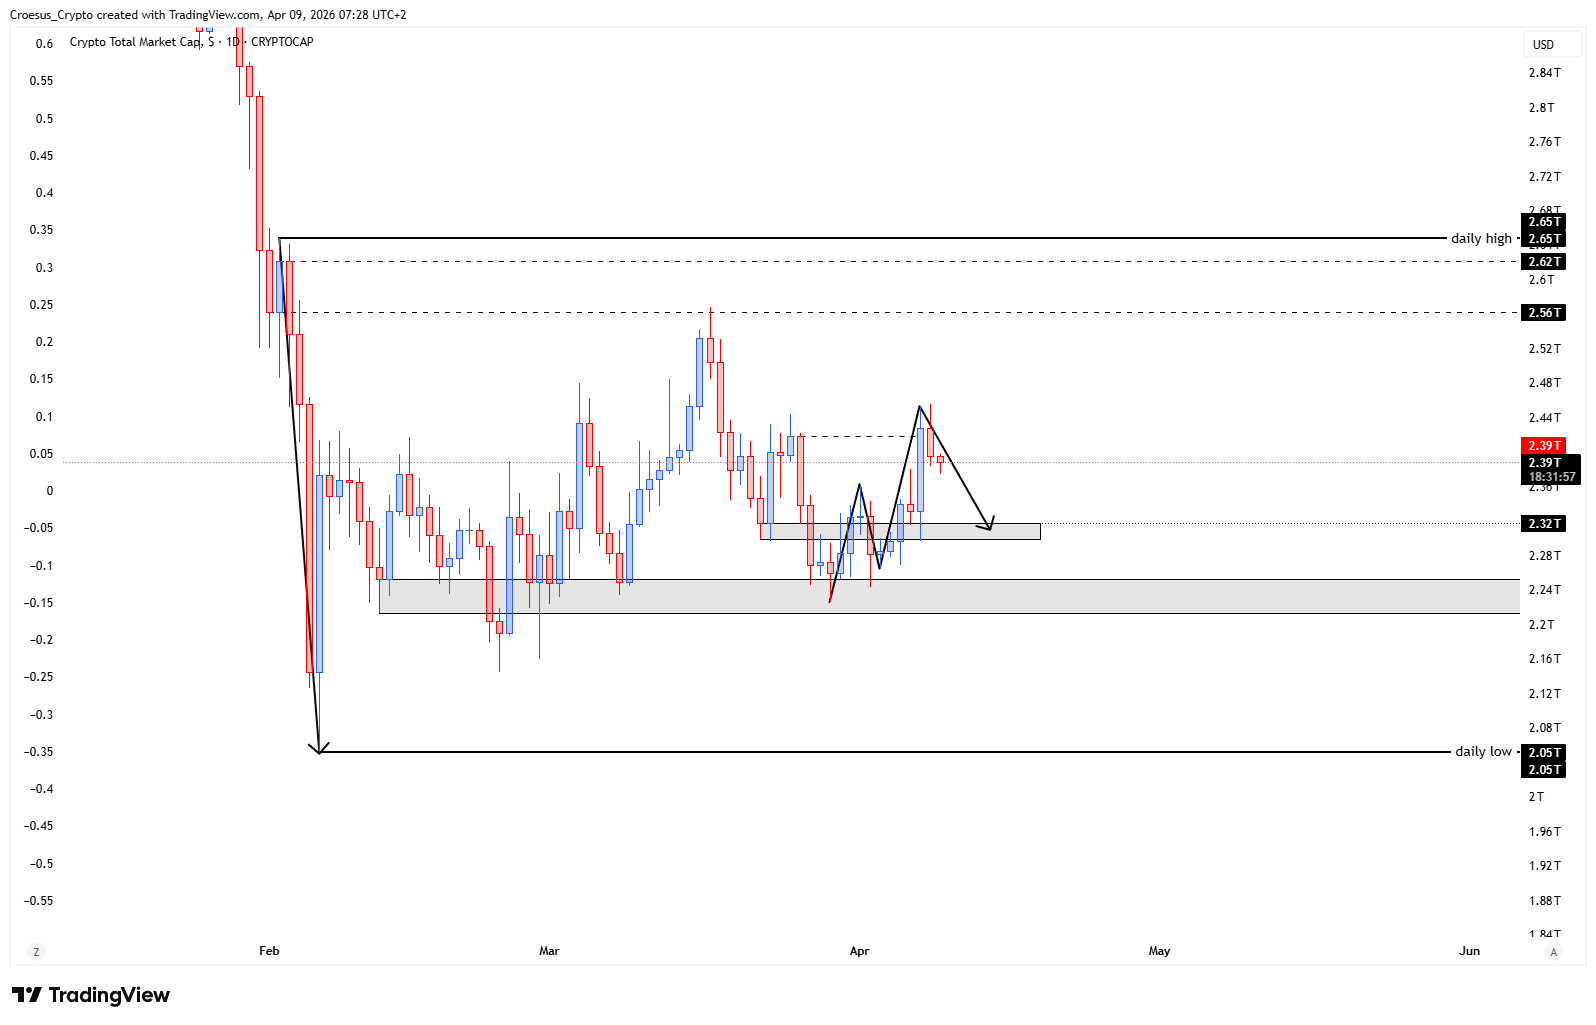
- If we look at the price development lately, we can notice two patterns developing at the base : an inverse head and shoulders with a double bottom and a bullish M structure. Daily entry zone would be the 2.32T zone (exact entry point to be defined on the 4H chart)
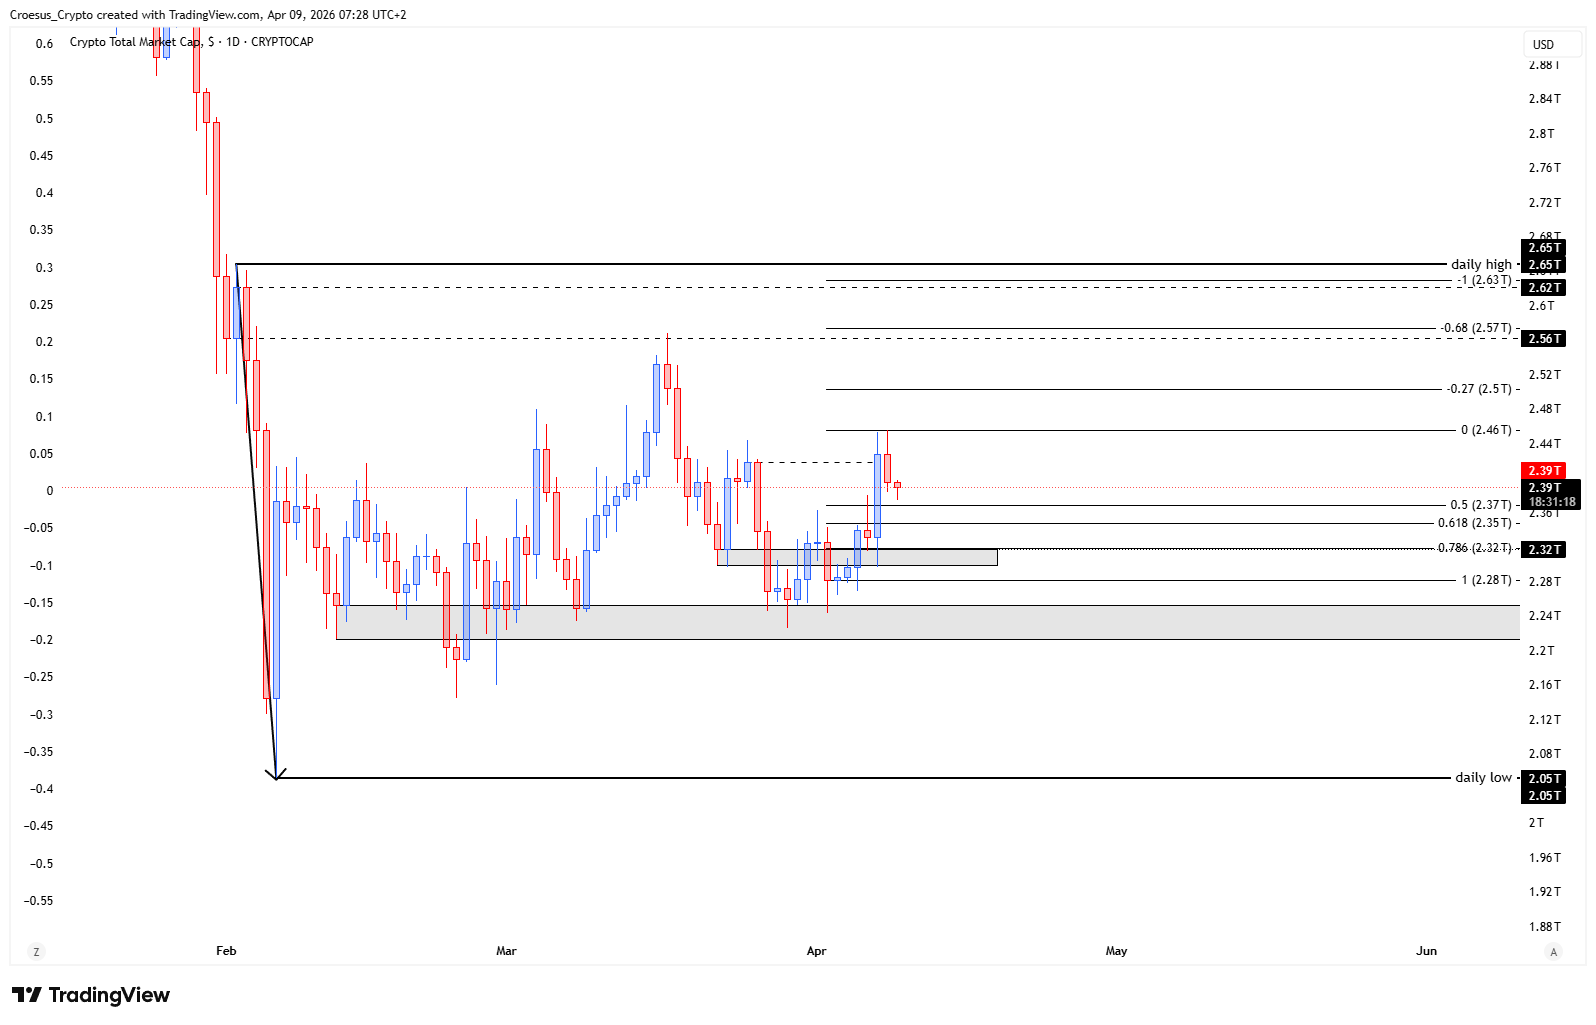
- If we look at the Fibonacci retracement of the last push up, we can clearly see that the 0.786 aligns with the top of the entry zone and the take profit levels -0.68 and -1 are situated just above the daily highs.
Market Structure Analysis
From a naked-trading perspective, the current relief after the impulsive push up reads like a corrective structure until proven otherwise. The key detail in this TOTAL daily analysis is that price is forming base structures (inverse head and shoulders alongside a double bottom), which typically signals demand stepping in after a pullback and sets a clear “line in the sand” for invalidation. At the same time, the stated “switch of momentum” keeps the short-term bias cautious: failed follow-through from the base would keep sellers in control and maintain bearish pressure into support resistance zones.
Fibonacci is used here as confirmation, with the 0.786 retracement aligning with the top of the $2.32T area, reinforcing it as a technically relevant decision zone.
Key Levels and Scenarios
Bearish continuation remains favored unless price reclaims and holds above the base structure with clean acceptance. A bullish scenario requires the $2.32T zone to hold and the developing reversal patterns to resolve upward, with upside progress likely reacting around the nearby daily highs referenced in the draft.
- $2.32T zone as the daily entry zone and key structural decision area
- Fibonacci 0.786 retracement aligning with the top of the entry zone
- Fibonacci take profit levels -0.68 and -1 situated just above the daily highs (overhead reaction area)
Trading Implications
In this TOTAL daily analysis, aggressive participants typically focus on confirmation inside the decision zone (and refine execution on lower timeframes like 4H), while conservative participants generally wait for a clear break of structure and acceptance away from the base. The main risk is getting chopped if price remains in a corrective range between the $2.32T support area and the daily highs overhead.
This analysis is for informational purposes only and does not constitute financial advice.