


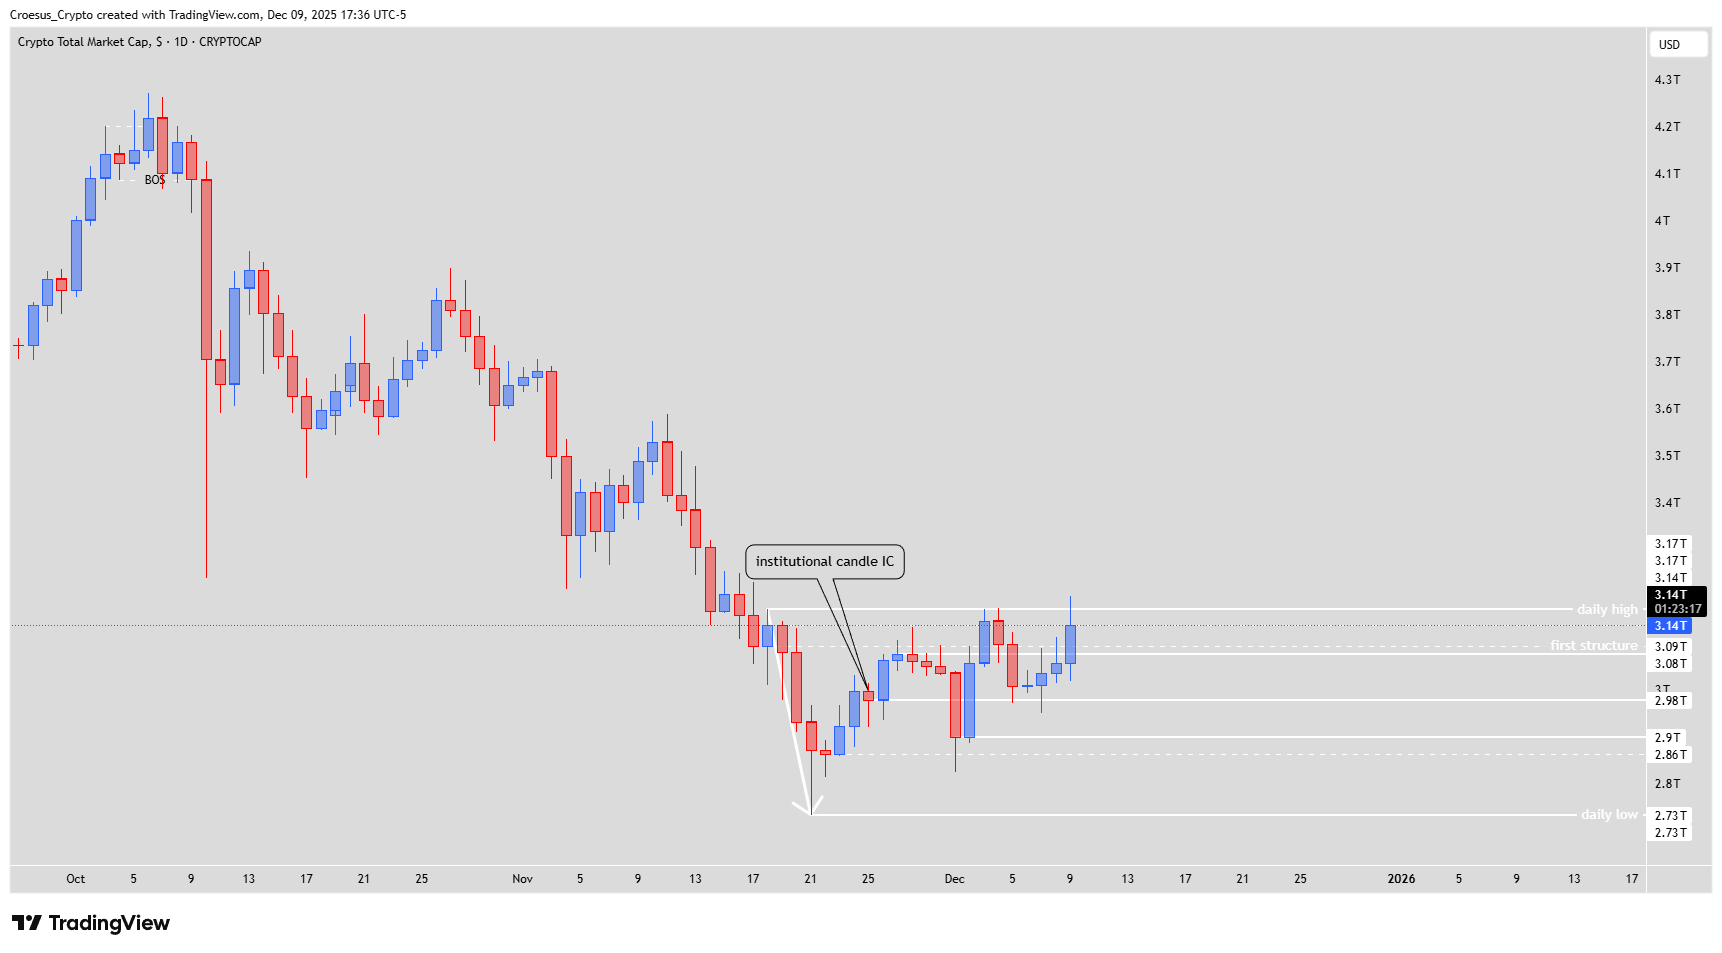
Our TOTAL daily analysis for 09 December 2025 shows the index pushing into the 3.17T daily high and getting rejected, keeping price locked inside a broader range between the recent lows and this resistance. Short-term candles are bullish, but the predominant trend on this timeframe remains bearish, so we treat the move as a corrective rally inside a larger downtrend while we wait for a decisive break of structure.
TOTAL daily chart 9 Dec 2025 with institutional candle, daily high/low and range structure highlighted.
Technical analysis
- We saw the index pushing further up, but getting rejected @ the daily high.
- There still isn't a clear break of structure showing us a clear direction. The index is still stuck in a longterm range.
- Eventhough the last 3-4 days were bullish, the predominant trend is still bearish.
- If our bias is bullish we can see a potential inverse head and shoulder set-up with the head @ 2.9T and the shoulder @2.98T. But we need to break the daily high
- But if your bias is bearish, confluent with the actual trend, we can see a potential head and shoulder, with the head @ 3.17T (=daily high) and the shoulder @ 3.08T
Market Structure Analysis
From a market-structure and technical analysis perspective, TOTAL is compressing inside a long-term range with no clear break of structure, so we treat 3.17T as major resistance and the recent lows near 2.73T as key support. The institutional candle around 2.9T marks an important demand zone and forms the “head” of a potential inverse head and shoulders; its neckline sits near the current range highs. On the other side, the failed push above the daily high sketches a classic head and shoulders idea, aligned with the prevailing bearish trend. Fibonacci retracement confluence around 2.98T–3.01T supports this pivot region as a decision point for continuation lower or a larger reversal higher.
Key Levels and Scenarios
Bullish scenario: a clean breakout and daily close above 3.17T would confirm a break in structure, invalidate the immediate bearish H&S and open the door toward the next resistance cluster and Fibonacci targets in the 3.25T–3.36T zone.
Bearish scenario: rejection below 3.17T and a move back through 3.08T would reinforce the dominant downtrend and put the 2.9T head and the 2.73T daily low back in play.
3.36T–3.25T: Fibonacci extension resistance zone if 3.17T breaks
3.17T: daily high and potential H&S head, key resistance for support resistance flip
3.08T: bearish shoulder and mid-range level to confirm downside continuation
2.98T: bullish shoulder and main Fibonacci retracement support
2.9T / 2.73T: inverse H&S head and daily low, critical higher-timeframe demand
Trading Implications
Until TOTAL breaks convincingly above 3.17T or below the 2.73T–2.9T demand area, we expect choppy price action, so traders may prefer reduced position sizing, waiting for confirmation of either H&S pattern and placing stops beyond the relevant head/shoulder invalidation levels.
This analysis is for educational purposes only and does not constitute financial advice.