


TOTAL Marketcap / Crypto Total Market Cap
TOTAL daily analysis 09/02/2026. The index is trading in a bearish context, with a corrective bounce attempting to develop after a Fibonacci completion, but structure remains capped by former support now acting as resistance.
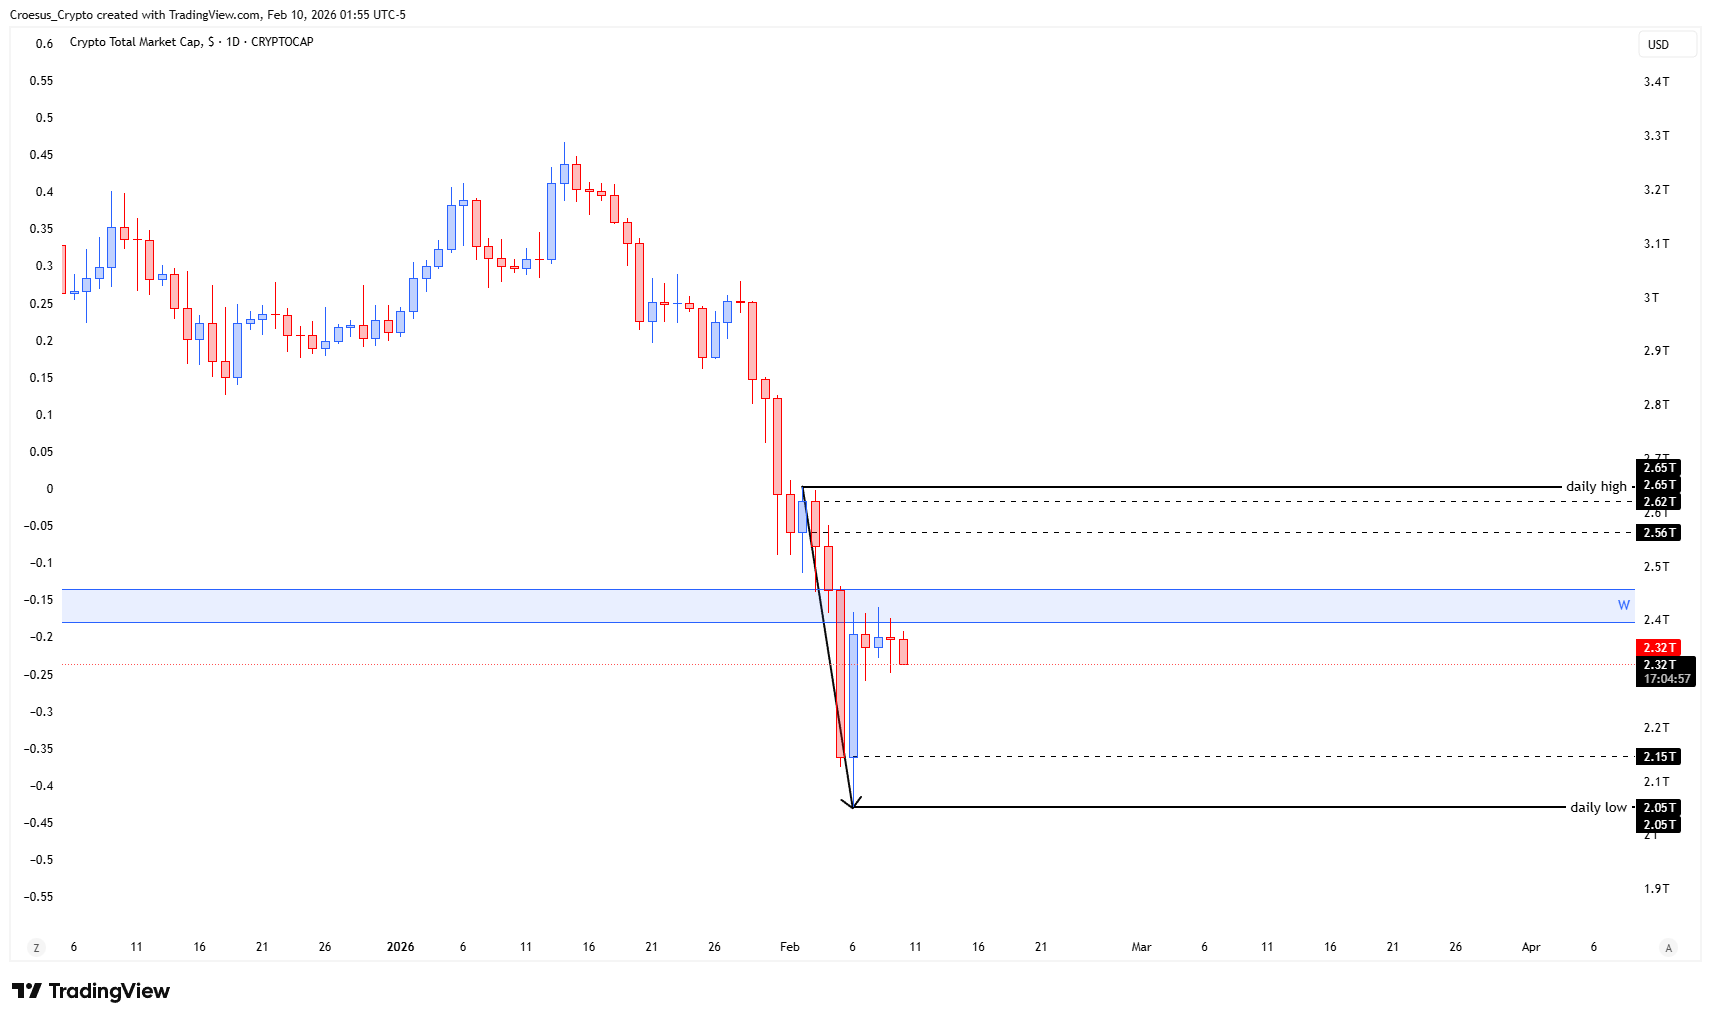
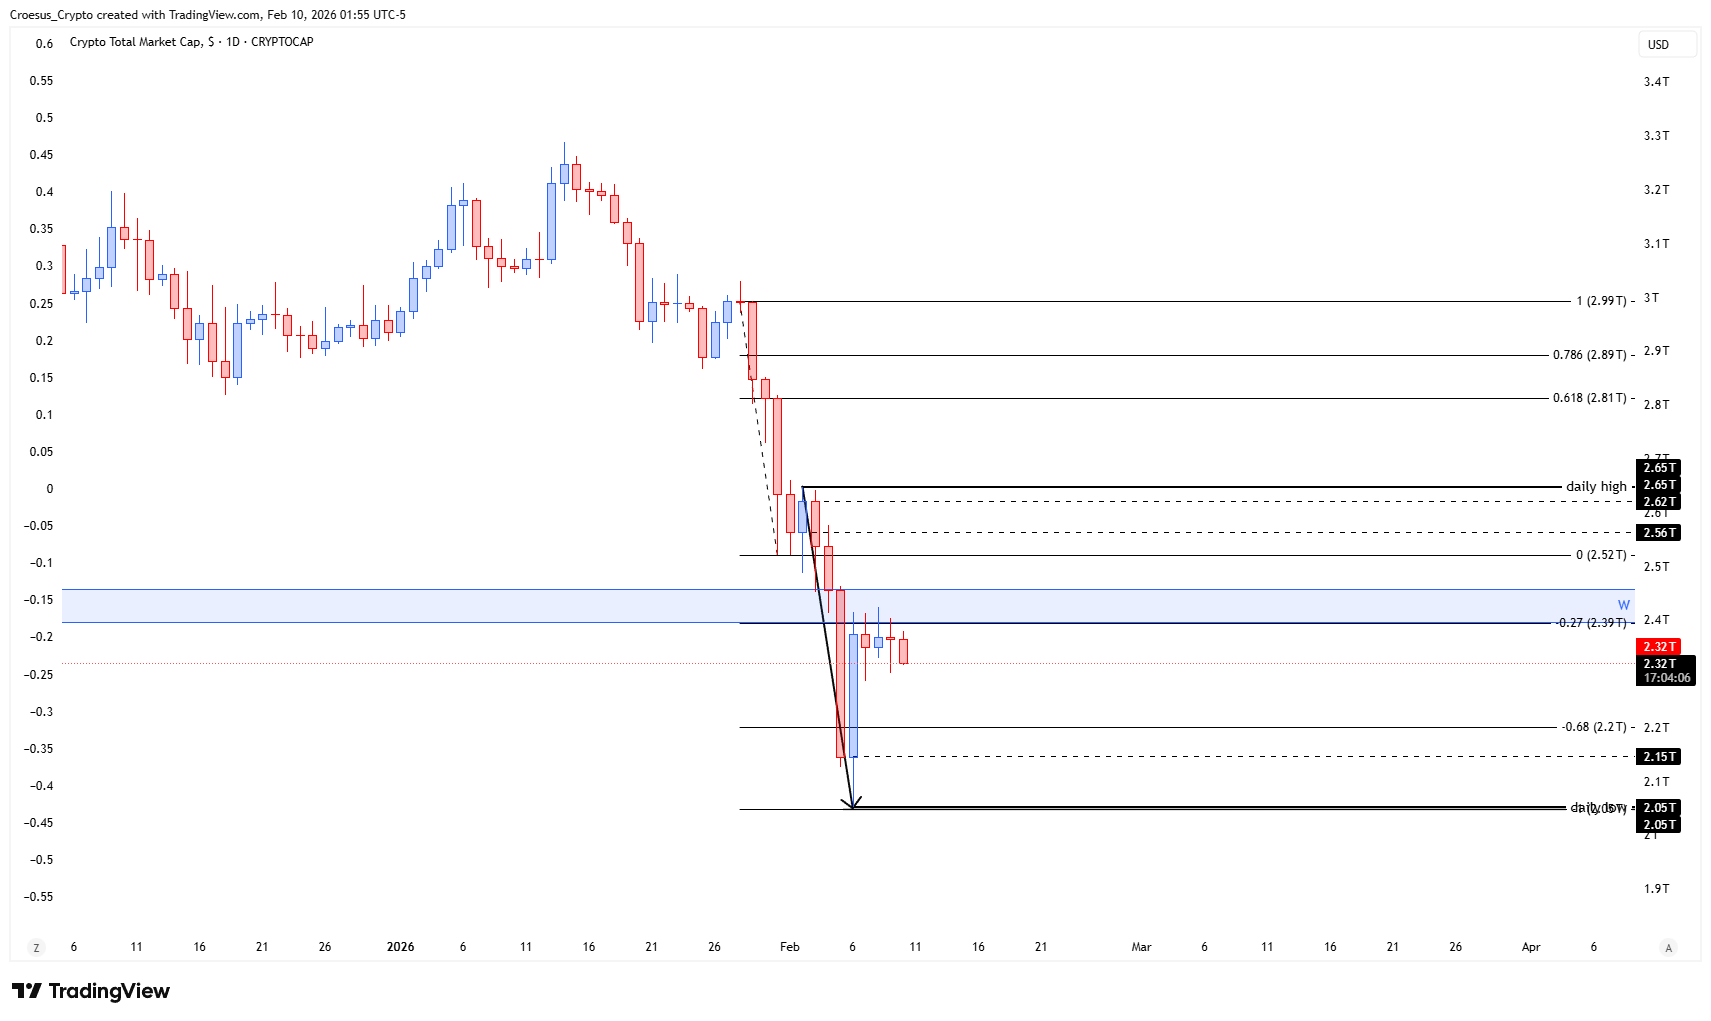
- After hitting the fib -1 completion level, we saw the index make a bullish correction.
- This correction was halted by a weekly support level being broken.
- This weekly support level seems to be acting as resistance now, keeping the index below it.
- An eventual pullback could still be a part of a larger ABC correction of the bearish impuls. This would mean we would first retest the daily low before seeing a larger bullish correction towards the daily high.
- But it could also simply be a bearish W, because the 0.618 fib retracement level has been activated.
Market Structure Analysis
From a market structure perspective, our TOTAL weekly analysis shows the bearish impulse remains the dominant leg, while the move off the fib -1 completion level currently reads as a corrective structure rather than a confirmed reversal.
The key shift is the weekly support break: once support resistance flips, that level often becomes a ceiling where supply re-enters. As long as price is holding below that prior weekly support (now resistance), the bounce functions as a retest zone rather than a trend change. The two paths outlined by the chart are structurally distinct: an ABC correction implies a measured corrective sequence that can still sweep liquidity at the daily low before rotating higher, while the bearish W scenario suggests the correction is already mature with the 0.618 Fibonacci retracement acting as the trigger zone for continuation lower.
Key Levels and Scenarios
Bearish continuation remains favored while the index is capped below the broken weekly support/resistance. A bullish alternative requires reclaiming that weekly level and holding it on a retest, which would strengthen the case for the “larger bullish correction towards the daily high” described in the plan.
- Broken weekly support level (now resistance) is the main invalidation/acceptance line
- fib -1 completion level is the origin of the current corrective bounce
- 0.618 fib retracement level is the active trigger area for the bearish W scenario
- Daily low is the key downside retest point in the ABC correction path
- Daily high is the upside reference for a larger bullish correction if structure flips
Trading Implications
In this TOTAL weekly analysis, aggressive participants typically focus on rejection signals at resistance, while conservative participants usually wait for a clear break of structure and acceptance back above the flipped weekly level. With Fibonacci and support resistance aligning, the current zone is a decision area where failed reclaim attempts can accelerate the bearish impulse.
This analysis is for informational purposes only and does not constitute financial advice.