


TOTAL Marketcap / Crypto Total Market Cap
TOTAL Daily analysis February 09, 2026. The total crypto market cap index remains bearish on the daily timeframe, with price currently in a bullish corrective move that is stalling into a major resistance reaction zone.
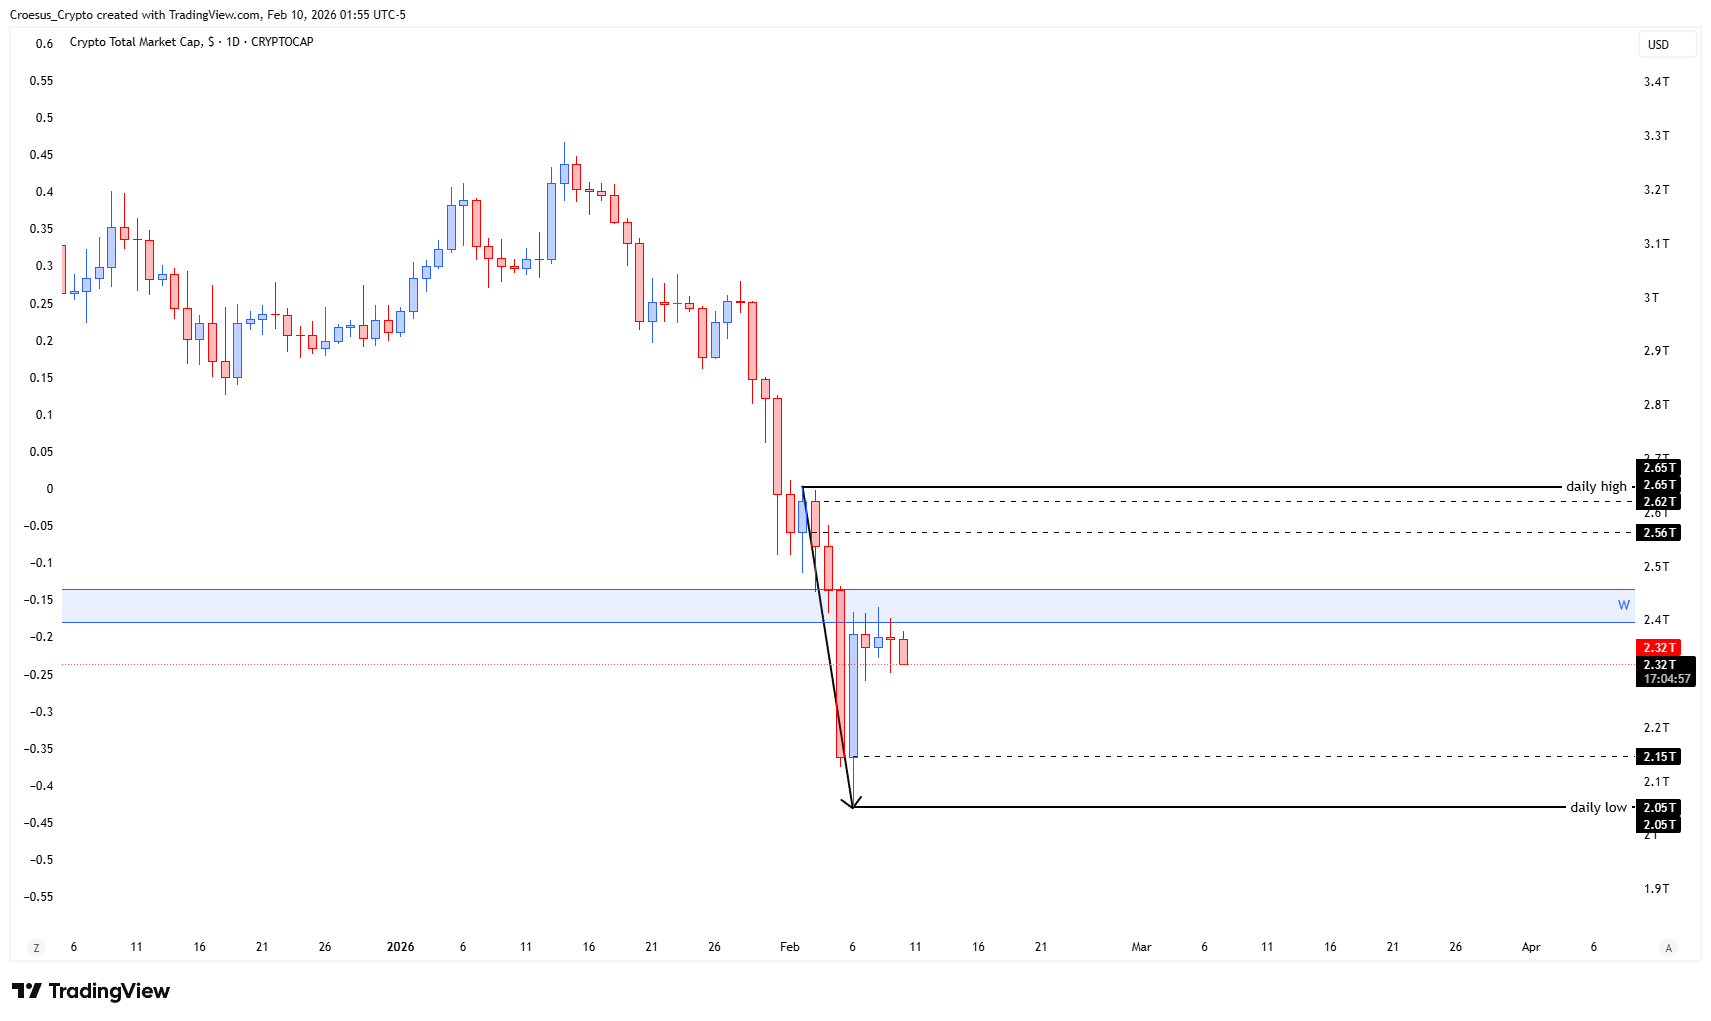
- The index showed us a bullish corrective move that was capped at a weekly broken support level that flipped as resistance
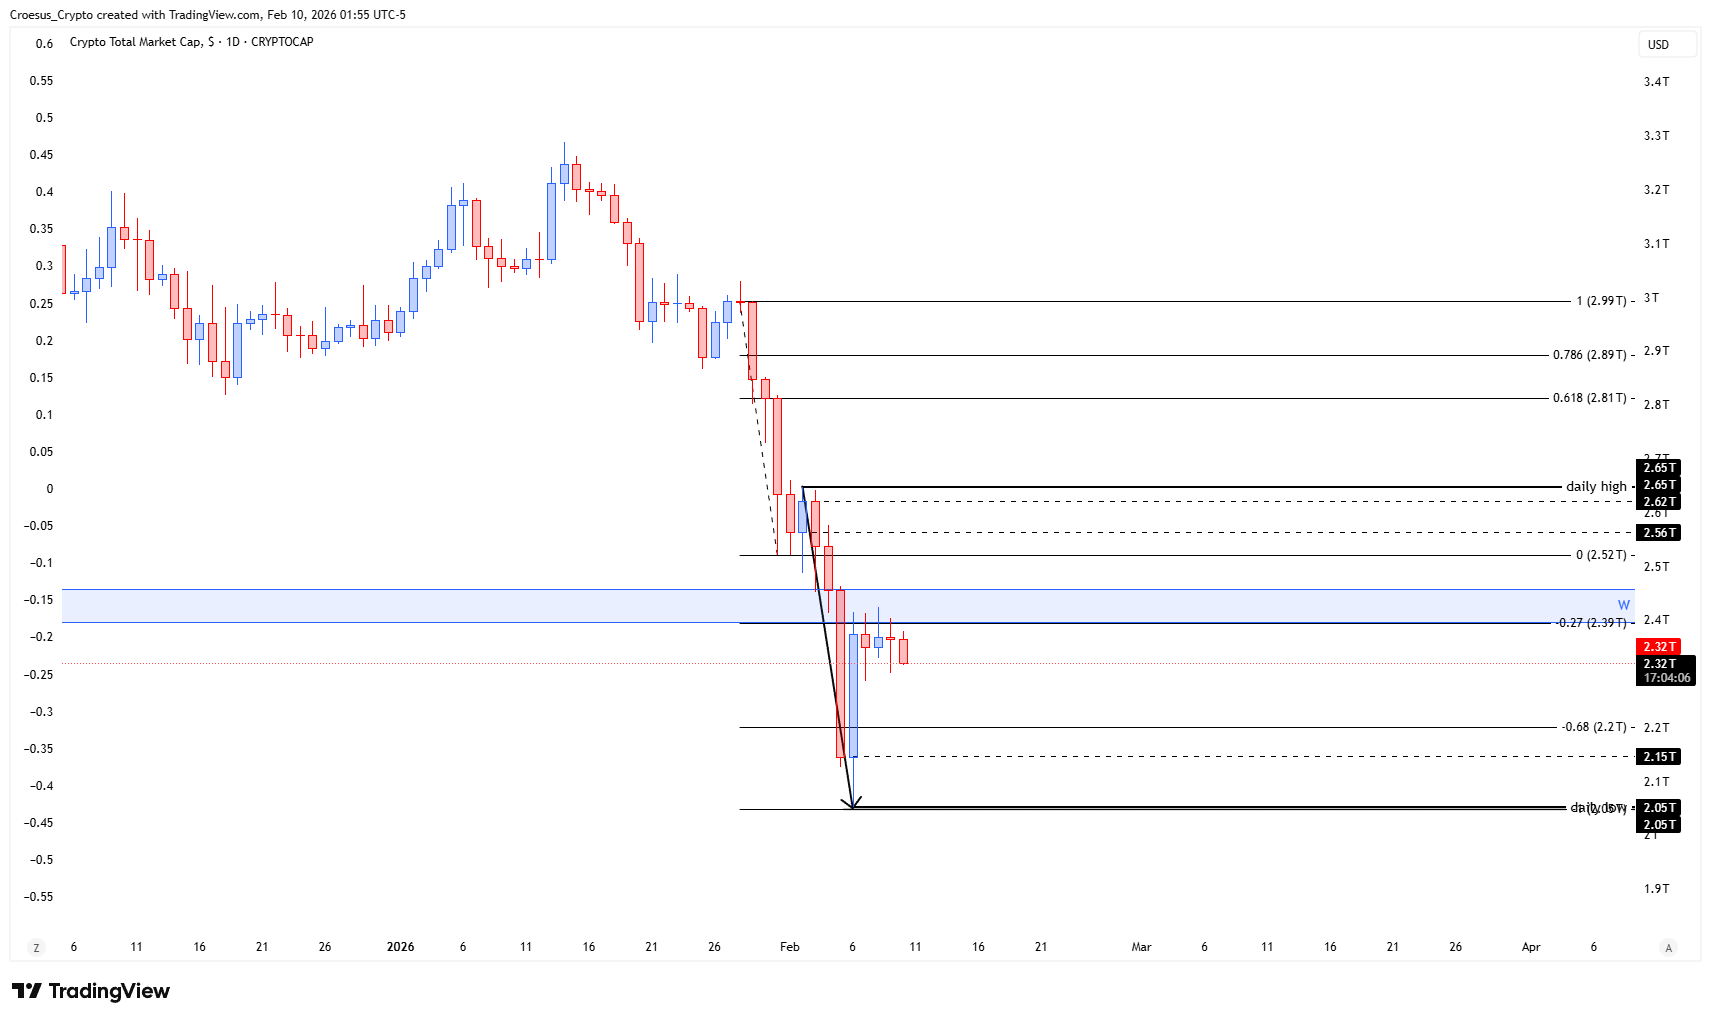
- This could develop two ways : either this is the start of an ABC correction (expecting a larger bullish retest of the daily highs) or this could be a bearish W (as the fib 0.618 retracement level has been activated)
Market Structure Analysis
In our TOTAL daily analysis, the dominant structure is still bearish, but the market is currently expressing a corrective bounce into a higher-timeframe supply area. The key detail is that the rally is capped at “a weekly broken support level that flipped as resistance,” which typically acts as a hard decision point: if price cannot reclaim this level, the move remains corrective and the broader bearish structure stays in control. This is a clean support resistance story—prior demand has likely turned into supply, and the market is testing whether sellers still defend that zone. With the fib 0.618 retracement “activated,” the current push also reads like a mature retrace area where corrective rallies often terminate before continuation legs resume.
Key Levels and Scenarios
Scenario A is an ABC correction path: price holds its current corrective structure and attempts “a larger bullish retest of the daily highs,” but only if the market can stop rejecting the flipped resistance and show acceptance above it. Scenario B is the bearish W outcome: the 0.618 retracement acts as a ceiling, price fails to reclaim the flip zone, and the market rotates back down in line with the prevailing bearish trend.
- Weekly broken support flipped as resistance: the main decision zone currently capping the rally
- Fib 0.618 retracement level: key confluence area supporting the bearish W scenario
- Daily highs: upside objective only if the ABC correction continues and acceptance builds above resistance
This analysis is for informational purposes only and does not constitute financial advice.