TOTAL Marketcap / Crypto Total Market Cap
TOTAL daily analysis 09 March 2026. The total crypto market cap is sitting at a key structural decision area where a potential reversal pattern remains active, but broader pressure still keeps the tape fragile on this timeframe.
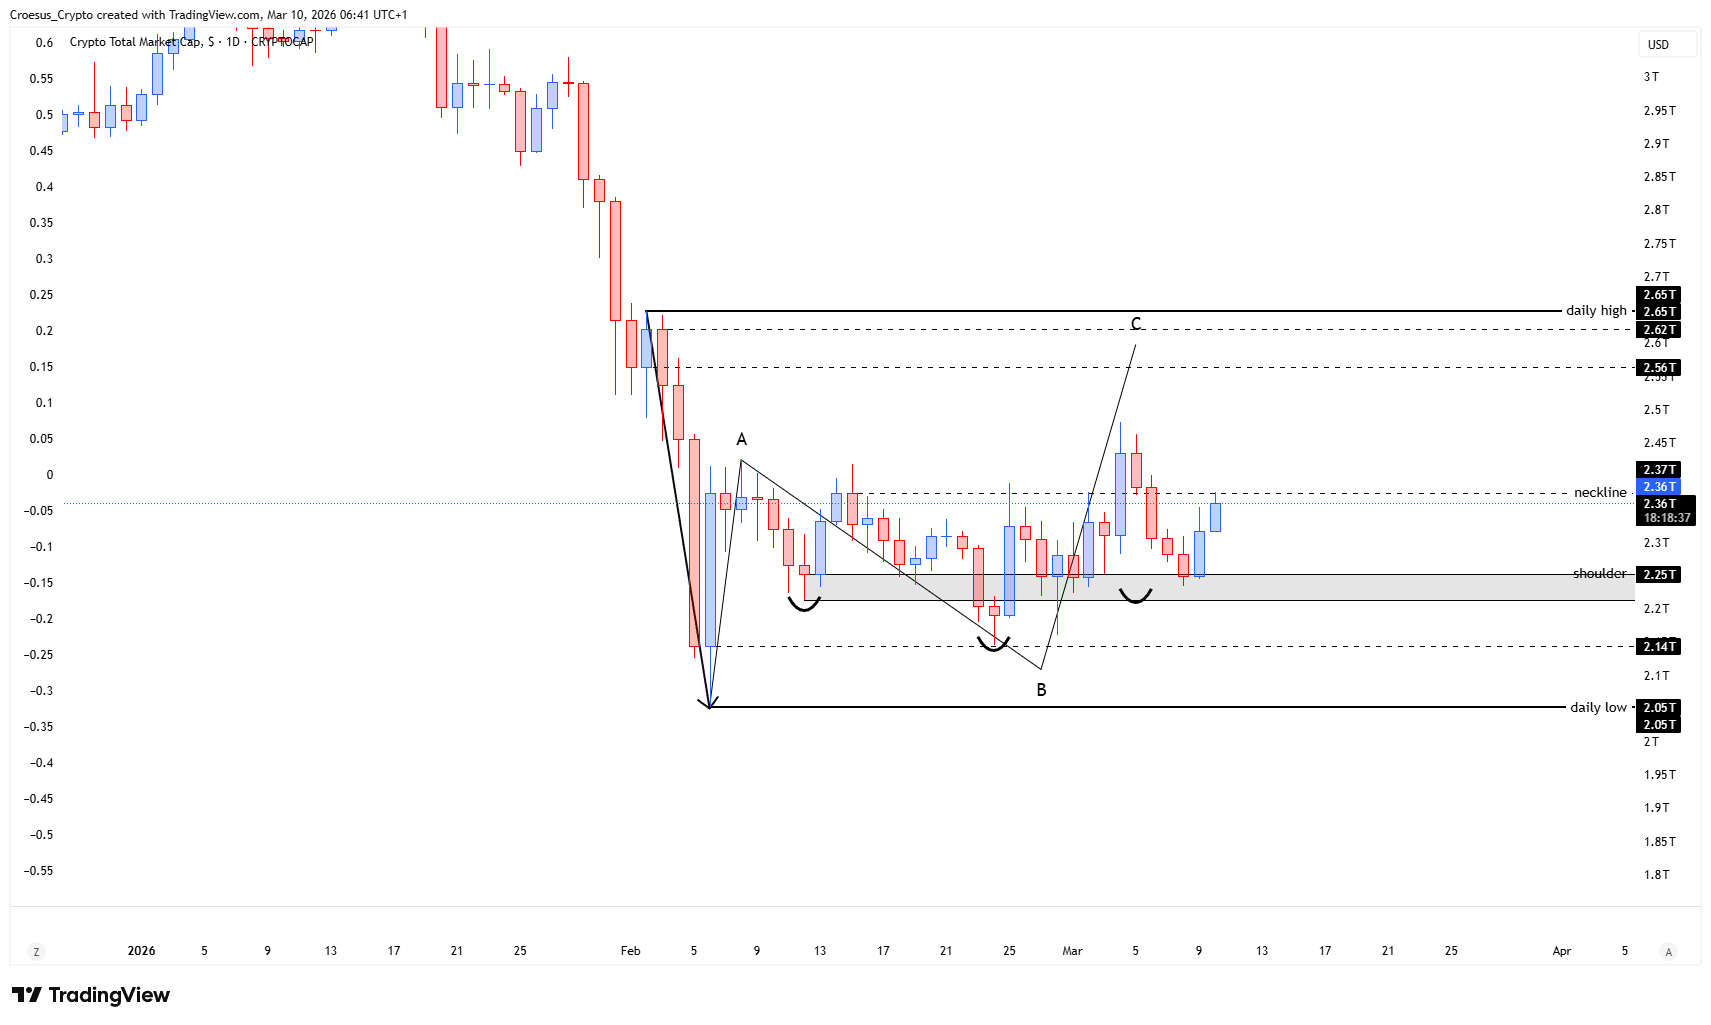
- The index retested the daily shoulder level, creating a bullish engulfing
- At this moment the inverse head and shoulder pattern is still in play
Market Structure Analysis
From a market structure perspective, our TOTAL daily analysis focuses on the “shoulder level” as the nearest horizontal support resistance flip zone inside the developing inverse head and shoulder. The retest into that level followed by a bullish engulfing candle is a clear reaction: sellers pushed price back into support, but buyers absorbed that move and closed back above the immediate rejection area.
Structurally, that type of candle response often appears during the “right shoulder” construction, where the market attempts to defend a higher low before challenging the neckline resistance again. However, with the broader trend still labeled bearish, we treat this as a counter-trend reaction until price proves continuation with clean impulsive follow-through rather than a one-candle bounce.
Key Levels and Scenarios
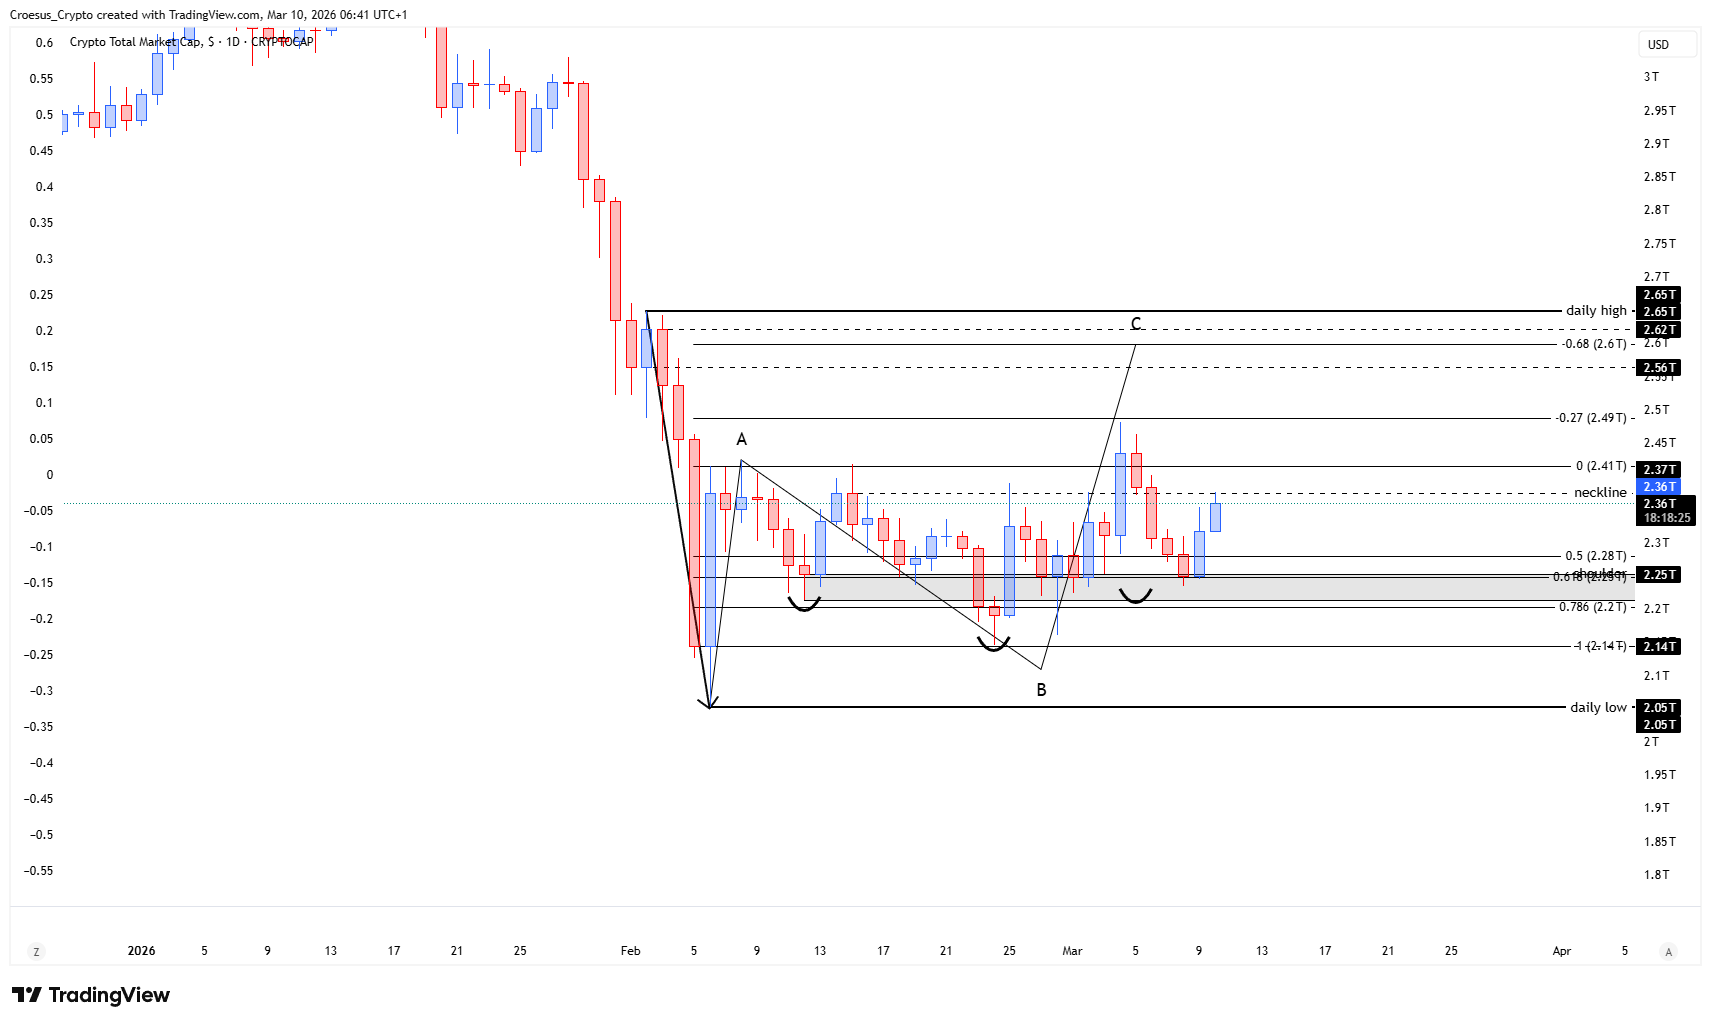
In this technical analysis, the bullish scenario requires the market to keep holding the shoulder support and build an impulsive push away from it, keeping the inverse head and shoulder structure intact. The bearish scenario resumes if price loses the shoulder level and accepts below it, invalidating the local defense and reopening downside continuation within the prevailing bearish context.
- Shoulder level (key structural support that must hold to keep the pattern valid)
- Neckline area (primary resistance zone the market needs to reclaim for reversal confirmation)
- Head low (major invalidation reference for the entire inverse head and shoulder structure)
This analysis is for informational purposes only and does not constitute financial advice.