


TOTAL Marketcap / Crypto Total Market Cap
TOTAL daily analysis 10 February 2026. The total crypto market cap is showing bearish follow-through after failing to hold a prior broken structure, keeping sellers in control until key support resistance is reclaimed.
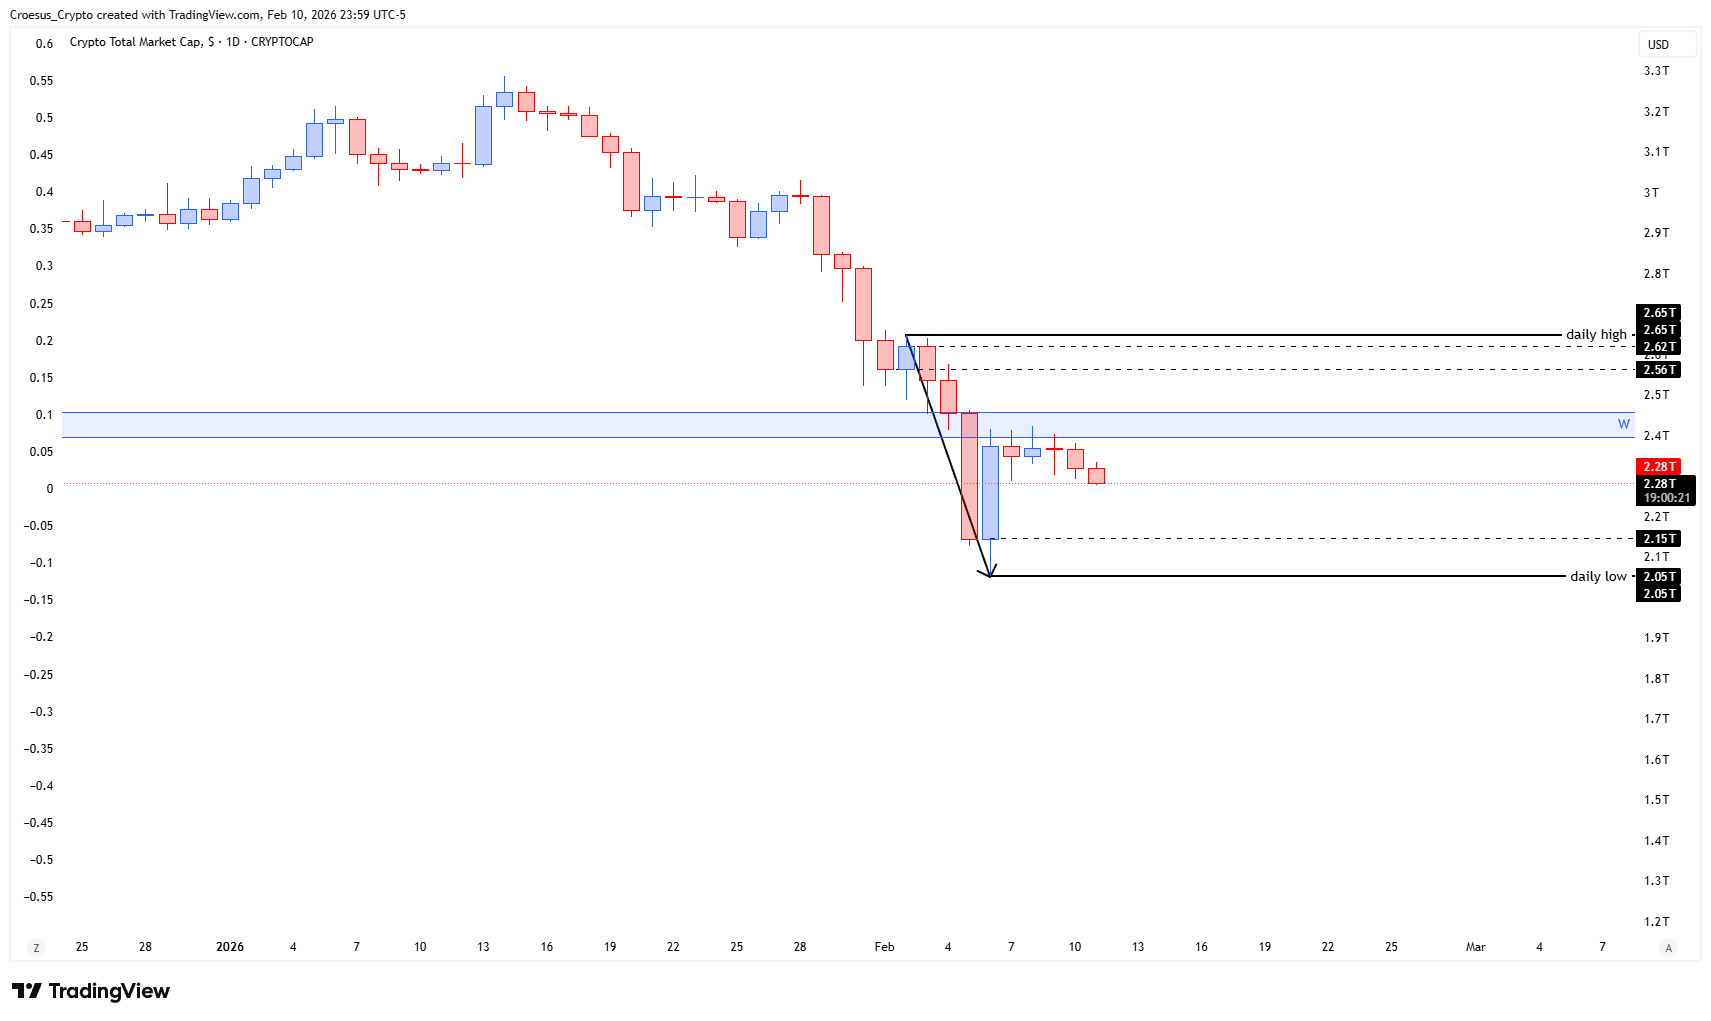
- The index shows us a bearish continuation after rejection on the weekly broken level. This level needs to be reclaimed in order to be bullish again
- This could develop two ways : either this is the start of an ABC correction (expecting a larger bullish retest of the daily highs) or this could be a bearish W (as the fib 0.618 retracement level has been activated)
Market Structure Analysis
From a market structure perspective, TOTAL remains bearish because price rejected at a previously broken weekly level, confirming it as resistance rather than reclaimed support. That rejection keeps the current swing structure pressured and signals continuation risk while bulls fail to flip that zone back into support.
Our TOTAL daily analysis also highlights a key decision point: the move can either unfold as an ABC corrective structure, where the market attempts a larger bullish retest into the daily highs, or it can resolve as a bearish “W” scenario now that the Fibonacci 0.618 retracement level is active.
Structurally, both outcomes revolve around the same idea: whether the market can produce an impulsive reclaim through the weekly broken level (bullish shift), or whether rebounds stay corrective and get sold into (bearish continuation).
Key Levels and Scenarios
In this TOTAL daily analysis, the bearish scenario remains the base case while price stays below the rejected weekly broken level. A bullish reversal attempt becomes higher probability only if the market reclaims that level and holds it as support, opening the door for a retest of the daily highs consistent with an ABC recovery. If the bounce remains corrective and respects the 0.618 Fibonacci zone as a pivot for renewed selling, the bearish W path stays in play.
- Weekly broken level: must be reclaimed to invalidate bearish continuation and shift structure bullish
- Rejection zone at the weekly broken level: near-term supply area where sellers defended
- Fibonacci 0.618 retracement level: active trigger zone supporting the bearish W scenario
- Daily highs: upside objective area if an ABC correction develops into a larger bullish retest
This analysis is for informational purposes only and does not constitute financial advice.